
- Starship’s 13th test flight was successfully conducted by SpaceX as the SPCX stock closed at a historic low following a 48% fall.
- From a technical analysis point of view, the critical support lies at $110.69 while the primary resistance is seen at $123.88.
- Morgan Stanley reiterated a price target of $300 as the share unlock date of August 6 approaches.
The SpaceX stock price prediction is under consideration as SpaceX shares closed with a record low due to the successful 13th test flight of the company’s Starship. It was the company’s first mission with the help of Starship since SpaceX got listed publicly on June 12. The stock has been declining and is well below its June high even despite the success of the mission.
SpaceX Stock Price Prediction: Impact of Successful Starship Test Flight
SpaceX completed its 13th Starship test flight on July 24.The mission was the first Starship launch since the company became publicly traded on June 12.
The launch had previously been delayed from July 23 because of weather conditions. Another planned mission on July 16 had also been postponed following mechanical issues.
During the latest flight, SpaceX successfully deployed 20 Starlink V3 satellites, expanding its newest satellite network. The satellites represent an upgraded version of earlier models and strengthen the company’s communications infrastructure.
Although the launch was completed successfully, the stock continued moving lower. Google Finance data showed SpaceX closing at $115.07, down 2.68% (-$3.17) during the July 24 trading session. After the closing bell, shares traded at $113.45, representing another 1.41% decline.
Key developments
- SpaceX completed its first Starship launch since its IPO.
- The mission deployed 20 Starlink V3 satellites into orbit.
- The shares continued to face pressure amid a significant achievement by the firm.
Technical Indicators Show Key Support Near $110
Trading activity during July 24 reflected continued selling pressure. Shares opened near $116, declined through the morning session, briefly fell below $112, and later recovered part of the losses before the market closed. Even with that rebound, the stock finished below the previous closing price of $118.24.
The four-hour TradingView chart placed the stock near $115.04, while remaining below major moving averages that continue to define the prevailing trend.
The 20-period exponential moving average (EMA) stands at $126.66, while the 50-period EMA remains higher at $146.28. Trading beneath both levels indicates that the broader technical structure remains bearish.
Momentum oscillators signaled that the selling pressure might start to ease. The Relative Strength Index (RSI) was 32.49 and above the RSI moving average of 30.16. Momentum was near oversold levels.
Fibonacci Retracements Levels Highlight SpaceX Stock Price Prediction
There are some Fibonacci retracement levels on which the SpaceX stock price prediction is based. Currently, the price is trading just above the 0.786 retracement level of $110.69.
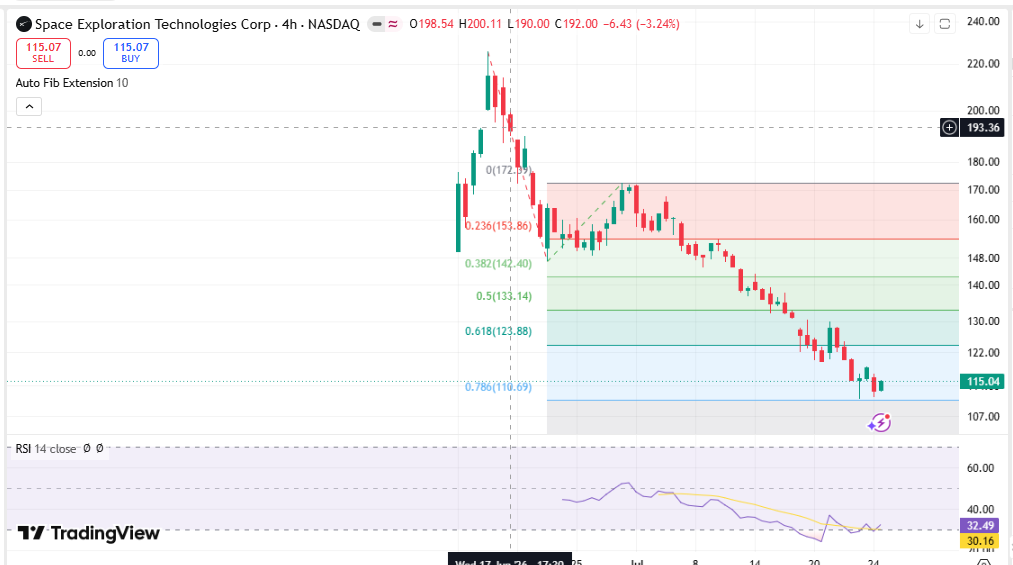
Source: Trading View
The next upside levels include the 0.618 retracement at $123.88 and the 0.5 retracement at $133.14. Recovering above those areas would move the stock through multiple resistance zones identified by the current chart structure.
A decline below $110.69 could shift attention toward the $100 psychological support, which has become the next closely monitored downside level.
| Technical Indicator | Level | Market Signal |
| Closing Price | $115.07 | Lowest close since IPO |
| Immediate Support | $110.69 | 0.786 Fibonacci level |
| First Resistance | $123.88 | 0.618 Fibonacci level |
| Second Resistance | $133.14 | 0.5 Fibonacci level |
| 20 EMA | $126.66 | Price remains below |
| 50 EMA | $146.28 | Long-term resistance |
| RSI | 32.49 | Near oversold territory |
Levels to watch
- Support remains concentrated around $110.69.
- Resistance begins at $123.88 before $133.14.
- A move below support could place $100 into focus.
Institutional Outlook and August Share Unlock
SpaceX shares have fallen approximately 48% from their June high of $225 to the July 24 closing price of $115.07. According to a recent CoinGape report, the decline has generated approximately $20 billion in gains for short sellers.
Another scheduled event is the planned August 6 share unlock involving approximately $116 billion worth of shares that have remained under selling restrictions since the June IPO.
Meanwhile, Morgan Stanley reiterated its $300 price target for SpaceX shares. According to the investment bank, it still regards the artificial intelligence, space technology, and satellite communication as important business areas for the company.
The bank stated:
“We believe the current disconnect between increasingly bearish investor sentiment and largely unchanged fundamentals creates an attractive entry point in SpaceX shares.”
The report also noted that ARK Invest has continued purchasing SpaceX shares during the recent decline.
FAQs
Why is the SpaceX stock price under pressure?
SpaceX shares declined after reaching a June high of $225 and closed at $115.07 on July 24, representing a 48% drop from the peak.
What is the closest support level to SpaceX?
The Fibonacci chart for four hours shows that the nearest support level is $110.69.
What are the resistance levels that traders keep an eye on?
There are two resistance levels $123.88 and $133.14 as per the Fibonacci retracement chart.