
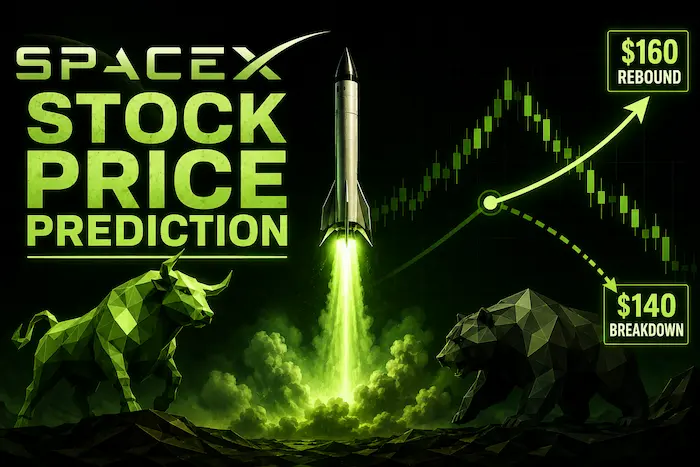
- SpaceX shares declined by 5.85% following the addition to Nasdaq 100 Index and $150 was the critical support level.
- The technicals were negative, although the low value of ADX indicated that there was no solid force behind the prevailing trend.
- Wall Street was bullish about the long-term prospects, while the $150 level was under the spotlight prior to the next price move.
After a dramatic sell-off of SPCX following the listing of the company in the Nasdaq-100, investors’ focus turned to the immediate prospects of the stock. This is despite a flurry of positive recommendations that were made by various Wall Street analysts concerning the stock.
The stock declined 5.85% to close at $151.04, erasing $9.38 from the previous session’s close of $160.42 as investors weighed valuation concerns against the company’s long-term growth plans.
Although inclusion in the Nasdaq-100 introduces a new source of passive investment demand, the limited public float has kept the company’s index weighting relatively modest.
SpaceX Stock Forecast Reliant on Critical Technical Levels
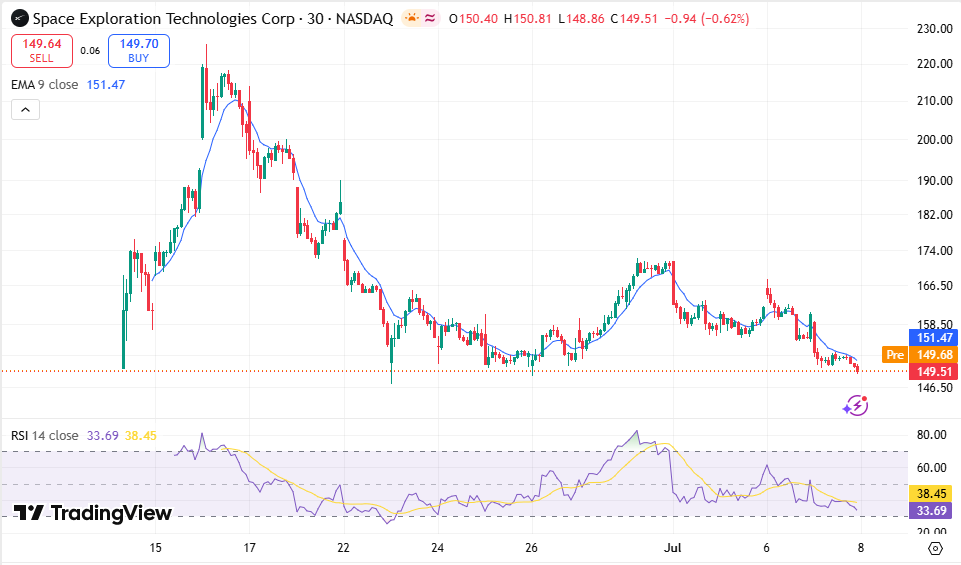
The latest four-hour chart revealed SPCX moving below several major moving averages, showing its short-term weakness.
The share was trading below the 10-period Exponential Moving Average (EMA) level of $157.62, 20 EMA at $162.90, and the 30 EMA level at $166.59. In addition, it moved below the Volume Weighted Moving Average (VWMA) of $159.24 and the Hull Moving Average at $153.56.
The momentum oscillators also confirmed the ongoing selling activity. The Moving Average Convergence Divergence (MACD) oscillator showed a level of -6.62, confirming its sell signal, while the Momentum oscillator was at -14.41.
Source: Trading View
At the same time, the Relative Strength Index (RSI) was at 41.79, staying at neutral levels but moving closer to weaker levels.
The Average Directional Index (ADX) showed a value of 8.44, confirming that the current trend was weak in terms of directional movement. The reading suggested that although the prevailing move remained negative, trend strength had not yet become firmly established.
Key Technical Highlights
- Support remains concentrated near $150, which has become the primary level that traders are monitoring.
- The momentum indicators are getting weaker, but according to ADX, the bearish momentum still lacks proper confirmation.
- There is significant resistance from $153.50 to $163, where multiple moving averages overlap.
SpaceX Technical Indicators
| Indicator | Value | Meaning |
| Current Price | $151.04 | Floating around the immediate support level |
| 10 EMA | $157.62 | The price is trading below |
| 20 EMA | $162.90 | Bearish short-term momentum |
| 30 EMA | $166.59 | Resistance levels remain above |
| VWMA | $159.24 | The price is trading below |
| Hull Moving Average | $153.56 | Resistance level around current price |
| RSI | 41.79 | Neutral with weakening momentum |
| MACD | -6.62 | A sell signal is active |
| Momentum | -14.41 | Negative momentum |
| ADX | 8.44 | Weak overall trend strength |
If that level fails to hold, the next technical areas are located near $145, followed by $140. A decline toward $140 would bring the stock closer to its initial public offering pricing area.
On the upside, the first recovery zone sits between $153.50 and $157.50. A broader rebound would require the stock to reclaim the $160 to $163 range, where several short-term moving averages and volume-weighted resistance levels are clustered.
Nasdaq-100 Entry Adds Passive Investment Demand
SpaceX officially entered the Nasdaq-100 after one of the largest public offerings in recent market history.
The inclusion requires exchange-traded funds and index-tracking products linked to the Nasdaq-100, including Invesco QQQ, to purchase SPCX shares in order to mirror the benchmark.
However, the company’s publicly traded share count remains relatively small compared with its overall valuation. Because only a limited percentage of outstanding shares are available in public markets, SpaceX entered the index with an estimated weighting of approximately 1.34%.
That weighting means passive funds will add exposure to the stock, although the scale of those purchases remains smaller than would normally be expected for a company valued at roughly $2 trillion.
Key Developments Following Index Inclusion
- Passive funds are required to hold SPCX after it is added to the Nasdaq-100.
- The company’s index weighting remains modest because of its limited public float.
- Index-related buying did not prevent the first-day decline, as valuation concerns remained in focus.
Passive buying provided another channel for demand generation, but the first trade after inclusion into the indices indicated that it is not enough to neutralize the overall selling force.
Analyst Coverage Highlights Long-Term Business Segments
Several investment banks initiated research coverage following the end of the post-IPO quiet period.
Morgan Stanley, Goldman Sachs, JPMorgan, Raymond James, and other firms published generally positive ratings centered on the company’s major operating businesses.
Analysts considered Starship, Starlink, and SpaceXAI to be the key factors that would help the company grow over a longer period of time.
Raymond James set the price target at $800, the highest level. Other research firms identified potential in satellite communications, launch services, space technologies, and artificial intelligence.
However, some independent research firms remained neutral or bearish on the stock, arguing that the current valuation already takes into account successful execution in the future. These divergent analyses were behind the inconsistent positioning of the investors amid widespread institutional coverage.
Intraday Trading Centers’ Attention on $150 Support
The current day’s trading activity marked a significant change in sentiment after the market opening.
The stock of SPCX started the trading day on the lower side, and then experienced more losses in early trade activity, getting close to the $150 mark. The losses slowed down thereafter, as the stock traded in a fairly narrow price range of about $150.50-$151.50.
The highest levels of trading took place during the early part of the decline, meaning that most of the selling activity took place soon after the market opened.
There were a number of important features that characterized the trading activity during the day:
- The selling activity was intense right from the time the market opened.
- Trading volume eased as prices stabilized near $150.
- The stock remained below the previous closing price throughout the session.
Despite the slower pace of selling, the shares remained well below the previous closing price throughout the day, leaving immediate attention focused on whether buyers continue defending the $150 area.
SpaceX Stock Price Prediction Focuses on Immediate Price Range
SpaceX Stock Price Prediction remains centered on the technical levels established after the stock’s first session inside the Nasdaq-100.
The company now benefits from passive demand generated by index-tracking investment funds while continuing to receive broad research coverage centered on Starship, Starlink, and SpaceXAI.
At the same time, the latest technical readings continue to show the stock trading below key moving averages, accompanied by negative momentum indicators.
For the near term, $150 remains the primary support level identified on the current chart. A sustained move below that level would shift attention toward $145 and then $140.
A recovery over $153.50 may put the next resistance levels at $160-$163 under watch as traders keep an eye on possible stabilization of the latest price downturn.
FAQs
Why does SpaceX stock trade close to the $150 level?
It trades close to $150 because it is the closest technical support level spotted on the 4-hour chart. Breaking it can draw attention to the further support levels at $145 and $140.
Why did SpaceX’s stock fall after being added to the Nasdaq-100?
It fell due to index inclusion as the market players evaluated valuation, technical weakness, and low free float of the company, which decreased passive money inflows.
What can be said about the technical signals?
The stock trades below its key moving averages, and the MACD gives a sell signal. RSI stands neutral at 41.79, and ADX shows that the current trend is weak.