Key Insights
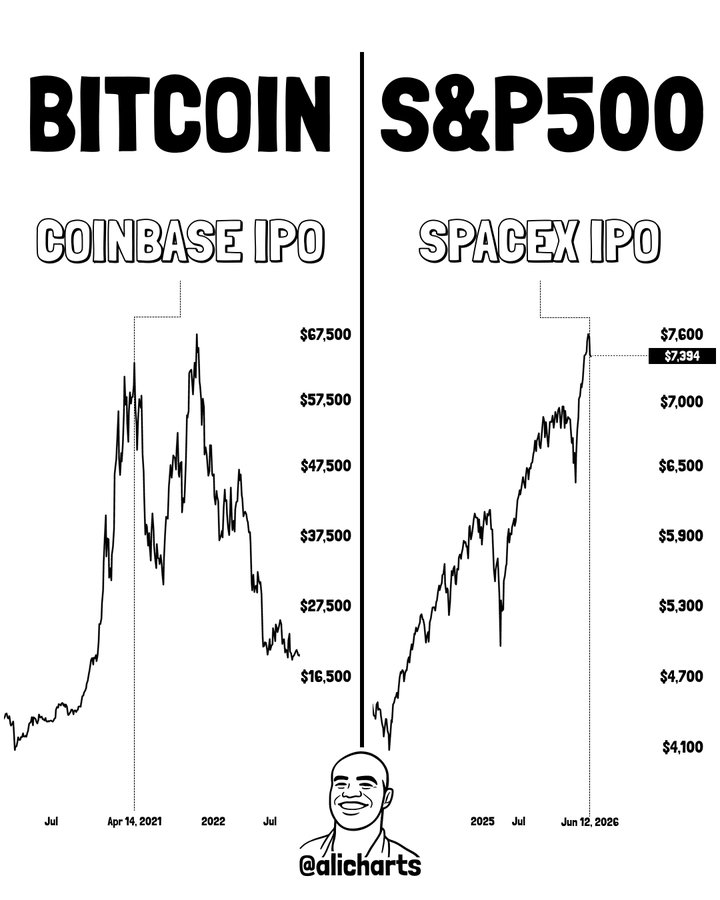
- The IPO of SpaceX takes place as the S&P 500 sits near 7,394 after gaining 80% off its lows on the chart.
- Ali Charts is saying the SpaceX IPO setup looks similar to the Coinbase IPO in 2021, which led to the 50% BTC correction.
- The resistance area of 7,500 to 7,600 on the chart will be important going forward.
The next big SpaceX IPO, to occur in the coming weeks, has captured the attention of financial markets as investors debate if the much-anticipated listing can occur during a period of pause from the S&P 500’s immense rally. In the chart, released today by Ali Charts, it shows the comparison of the market against what we saw leading into the Coinbase IPO in April 2021, which was also marked by the large peak from Bitcoin prior to a swift correction.
SpaceX IPO Arrives After a Year of Strong Market Gains
The S&P 500 rally heading into the SpaceX IPO has been solid. As you can see from the chart Ali Charts provided, the benchmark index jumped from 4100 or so all the way to nearly 7394, where it is trading near its highs.
The basis of comparison is a known trend. Oftentimes, as big IPOs, both companies get a ton of investor interest during periods of strong uptrends, giving optimism quite the high. For the SpaceX IPO, a period of strength has already taken place.
Ali Charts Compares the Event to Coinbase’s Market Debut
In an X post, Ali Charts draws parallels between the context of the SpaceX IPO and that of Coinbase when it went public in 2021.
Both listings, according to the chart, followed long periods of bullish performance. In both scenarios, the IPO was seen as a marker in a fast-growing industry.
The analysis does not seek to replicate outcomes, but to understand investor behavior. Comparing the two lists analyses how anticipation of a major listing can occur at a time when much of the positive story is already factored into prices.
Source: Alicharts
Key Figures From the Comparison
| Metric | Coinbase IPO Period | SpaceX IPO Period |
| Asset Compared | Bitcoin | S&P 500 |
| Starting Level | ~$5,000 | ~4,100 |
| Peak/Current Level | ~$64,000-$67,500 | ~7,394 |
| Major Event | Coinbase IPO | SpaceX IPO |
| Rally Magnitude | 1,200%+ | Approximately 80% |
While the assets differ significantly, the chart focuses on market psychology rather than direct price correlations.
Coinbase IPO Marked a Turning Point for Bitcoin
Coinbase IPO occurred on April 14 th of 2021 during a of one of the strongest phases in the cryptocurrency market’s history. In the context of that event, Bitcoin has gone from pandemic-era lows of roughly $5000 to over $64,000 before listing.
Several forces propelled that rally: increased institutional participation; growing corporate treasury acquisitions and record retail-investor entry; all the while buoyed by liquidity conditions in favor of risk assets.
Bitcoin Corrected After the Listing
Bitcoin saw a steep correction shortly after Coinbase’s IPO. In the aftermath of the public debut, the crypto saw its value plummet by approximately 50%, toward the $30k mark before later rallying to all-time highs around $69k.
The chart from Ali Charts highlights the Coinbase IPO as the time when levels of excitement from investors rose so high that profit-taking among market participants had started to become a part of the market following the long-anticipated day.
A “sell-the-news” event of this nature can be commonly witnessed throughout financial markets. Investors often buy up a position, then as the event approaches, they start to exit their position upon the event taking place.
It is important to note that from this chart, it does not indicate that the Coinbase IPO was solely the cause for the crash. Rather, it shows that major events like the IPO are occurring at times that the market may be prone to consolidation.
Key Levels Gain Attention Ahead of the SpaceX IPO
The right side of the chart focuses on the S&P 500 and identifies several technical levels that investors may monitor as the SpaceX IPO approaches.
Resistance Remains Near Recent Highs
As can be observed from the chart, the major zone of resistance lies between 7,500 and 7,600. The zone is in confluence with recent highs and is where the profit-taking action could start from.
A sustained movement above this zone will show that buyers have firm control, and a further move could be expected.
Important Support Levels Below Current Prices
The analysis also identifies several support areas that could become relevant if the market enters a consolidation phase.
| Support Zone | Description |
| 7,000 | Initial support level |
| 6,500 | Secondary support zone |
| 5,900-6,000 | Major long-term support area |
Even a retreat toward these levels would leave the broader uptrend intact based on the structure shown in the chart.
Focus Remains on Investor Sentiment
The core focus of the discussion is sentiment. Both the Coinbase and SpaceX IPOs were launched at the end of a lengthy run-up, extensive press coverage, and heavy investor demand.
The SpaceX IPO could potentially be the next big sentiment event, arguing the case that the S&P will either rise higher or turn to consolidation.
Investors will closely watch the SpaceX IPO as the S&P trades around highs. The SpaceX IPO will be the next big test of market demand, after this lengthy rally to the top.
FAQs
1. Why is the SpaceX IPO being compared to the Coinbase IPO?
The comparison is based on market sentiment. Both the SpaceX IPO and Coinbase IPO followed strong rallies and attracted intense investor attention before their public debuts.
2. What level is the S&P 500 currently trading at?
According to the chart shared by Ali Charts, the S&P 500 is trading near 7,394, placing it close to a major resistance zone between 7,500 and 7,600.
3. Does the analysis predict a stock market crash after the SpaceX IPO?
No. The analysis does not forecast a crash. It suggests the SpaceX IPO could coincide with a period of consolidation or profit-taking after a prolonged market advance.
4. What are the key support levels to watch after the SpaceX IPO?
The chart identifies support levels around 7,000, 6,500, and the major support zone between 5,900 and 6,000 for the S&P 500.