

- Dogecoin price has continued to rise with a 6.3% surge and remains above critical moving averages, further strengthening its buying sentiment.
- Dogecoin ETFs have seen no movement after a single inflow day and accumulated net inflows have reached $12.12 million.
- The futures interest was at $1.10 billion, and DOGE tested important resistance around $0.0740.
Dogecoin price bounced back in positive fashion in the last 24 hours after technical indicators suggested that the crypto is making a buying run despite another dull day of ETF trading. ETF trading volume was flat throughout the week, and the crypto asset bounced back from recent lows and tested some key higher timeframe resistance levels on its 4-hour chart.
Dogecoin Price Rises as Trading Activity Grows.
The price of Dogecoin was fluctuating around $0.07375, with a 6.3% increase in the past 24 hours. Due to the recovery, the cryptocurrency rallied its market capitalization by 44.75% to $12.6 billion, while the volume of trading went up 44.75% to $821.87 million.
Despite previous weakness, the trading session brought back the buying pressure and continued to extend into higher resistances. As the price recovered, the trading volume increased, indicating increased trading activity during the price recovery.
Key Highlights
- The price of Dogecoin has just bounced off of a low, crossing the 20, 50, and 100 EMAs.
- On July 21, Dogecoin ETFs saw $345,130 in inflows before resuming a zero daily in-flow for the next three sessions.
- DOGE futures’ open interest grew to $1.10 billion, and technical indicators remained in check for resistance at $0.0740 and $0.0753.
Dogecoin Price Tests Key Technical Resistance
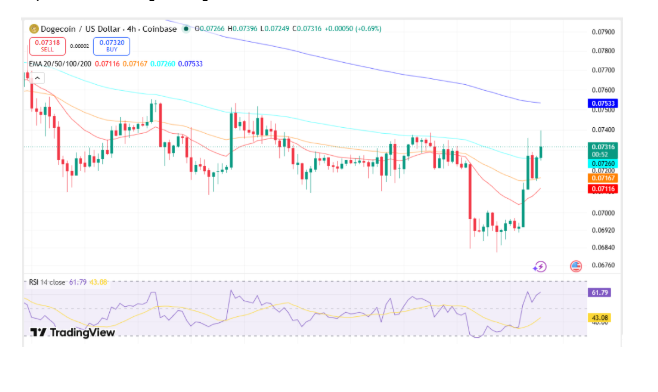
Dogecoin price has rallied above a number of key moving averages on the 4-hour chart following a recent low around $0.0685.
The asset has crossed the 20 period EMA $0.0712, 50 period EMA $0.0717 and 100 period EMA $0.0726 indicating a better short term market structure.
The 200 period EMA, however, at $0.0753 acts as the main overhead resistance. If it were to move above that level, Dogecoin will have broken all four of the major exponential moving averages on the chart.
Source: Trading View
In addition, momentum indicators helped confirm the rebound. The Relative Strength Index (RSI) was up at 63.26, indicating that buying interest had increased but still not in overbought levels.
Further technical analysis revealed that it was testing the 1.618 Fibo extension at $0.0740, the immediate resistance level. Buyers should consider $0.0759 as the next Fibonacci level and the 2.618 extension, if they form a sustained move above $0.0740. Conversely, a rejection at current levels may bring the focus back to support in $0.0725-$0.0717.
The same analysis also revealed a $0.0739 ceiling in terms of support and resistance. If the price takes out the area, it could move the price upwards to around $0.0750, but if it fails to hold the price, it may consolidate above the $0.0710 support level.
Dogecoin ETF Inflows Resume at Zero.
While price action improved, ETF activity remained largely unchanged.
Data from SoSoValue shows that Dogecoin ETFs saw no net inflows on July 24.The same result was reported on July 22 and July 23, extending a pattern of inactive trading days.
However, The daily inflow this week occurred on July 21, when Dogecoin ETFs attracted $345,130. That marked the first inflow after an extended period during which daily totals remained at zero beginning July 6.
Despite the recent slowdown, cumulative net inflows continued to hold above $12 million. As of July 24, cumulative net inflows reached $12.12 million.
Weekly figures also improved modestly. The positive inflow total recorded on July 21 amounted to $345,130, marking the first positive week for Dogecoin since the week ending June 18.
Futures Positioning and Monthly Signal Remain in Focus
The activity in the derivatives market was rather different. Despite the recent price fluctuations, DOGE futures open interest was reported to be around $1.10 billion, showing continued engagement in the futures market.
Dogecoin’s price was slightly down as of the last update, capping its 24-hour loss at 0.17% to currently hover around $0.07. Continuous futures trading activity was seen as the open interest in trading increased and prices in the spot market saw a decline.
Meanwhile, crypto analyst Ali reported that the TD Sequential indicator generated a monthly buy signal as Dogecoin approached a long-term support level near $0.056.
According to the analysis, maintaining support around that level could allow a recovery toward $0.16, while the upper boundary of the longer-term channel remains near $0.45.
FAQs
What is the reason behind the Dogecoin Price Uptrend?
Dogecoin price is continuing its rally from an earlier low with volume up 44.75% and the 20, 50 and 100 EMAs crossed above the price.
Will Dogecoin hit the next resistance level?
The initial support level is at $0.0740, with the 200 EMA at $0.0753 and the Fibonacci extension at $0.0759.
What is the amount of money that has been deposited into Dogecoin ETFs?
According to data and as of July 24, Dogecoin ETFs had reported a total of $12.12 million in net inflows, with just $345,130 in inflows on July 21.



