

- Arbitrum ARB jumped 123% over the week to trade at $0.1946 as the trading volume spiked by 332% to $1.11 billion.
- The Robinhood Chain activity contributed to Arbitrum’s growth since the income of the protocol rose.
- ARB became oversold with resistance at $0.2189 and support at $0.1814
Arbitrum (ARB) has recorded a sharp rally, climbing about 123% over the week to around $0.1946 as trading activity expanded significantly. The move followed a breakout from a consolidation base near $0.0862 and pushed ARB above several major technical indicators.
Arbitrum (ARB) Breaks Above Key Technical Levels
The daily Arbitrum (ARB) chart shows price accelerating from the recent consolidation area and moving above the 20-day, 50-day, 100-day and 200-day exponential moving averages. Those levels stood at $0.1174, $0.0998, $0.0974 and $0.1192, respectively.
ARB also moved above several Fibonacci extension levels during the rally. The token cleared the 1.618 extension at $0.1439 before breaking through the 2.618 level at $0.1814. The next cited Fibonacci resistance is the 3.618 extension at $0.2189.
The move also carried ARB above historical levels around $0.08400 and $0.07209. Price subsequently entered an area described in the supplied market data as open price discovery above $0.206.
RSI Signals Extremely Overbought Conditions
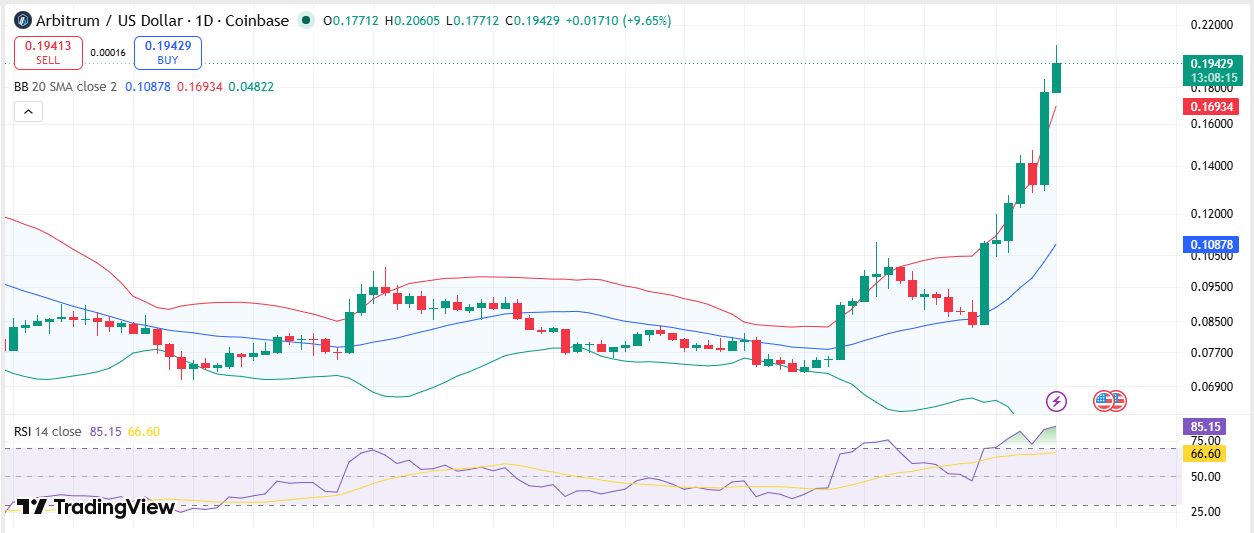
Despite the strength of the advance, technical indicators show elevated short-term momentum. On the daily chart, ARB is trading at $0.19486, which translates into a rise of 9.97%, beyond the Upper Bollinger Band of $0.16953.
Source: Trading View
The token also moved well above its 20-day simple moving average of $0.10881. The Relative Strength Index stood at 85.22, compared with a signal-line reading of 66.61.
The RSI level indicates severely overbought conditions within the supplied technical data. The price action beyond the Upper Bollinger Band draws attention to the likelihood of short-term consolidation towards the region of $0.1695.
If such a move occurs, the $0.1814 and $0.1439 Fibonacci levels have been identified as the primary support areas following the breakout.
Robinhood Chain Adds a Revenue Catalyst
Activity connected to Robinhood Chain has become a major part of the latest Arbitrum narrative. The Robinhood Chain is designed as an Arbitrum chain, and its transactions have brought in revenue exceeding $2 million within 24 hours.
According to the data provided, 10% of protocol revenue goes back to the Arbitrum ecosystem. In case the revenue rate of $2 million per day was maintained throughout the year, it would amount to $73 million. This figure is an annualized calculation based on the reported daily revenue and the stated 10% allocation.
Robinhood Chain’s reported gross revenue also increased from approximately $54,700 on August 22 to more than $1.08 million on August 30. During the same period, Arbitrum’s matching share increased from about $5,400 to $108,000.
Arbitrum Ecosystem Metrics Improve
Data from the Arbitrum Foundation showed that its networks processed 478 million transactions during the first half of 2025. Average monthly stablecoin transfer volume during that period exceeded $70 billion.
ArbitrumDAO also recorded $6.19 million in revenue during the period covered by the supplied data. In July, Robinhood Chain’s first month on mainnet, Expansion Program license fees represented 35% of DAO revenue.
The figures place transaction activity, stablecoin transfers and protocol revenue alongside the sharp increase in ARB’s market price.
Futures Open Interest Adds Leverage
The rally has also coincided with increased participation in ARB futures. Open interest was reported to have risen by approximately 30% since August 31, as traders established additional long positions during the breakout.
The increase in open interest indicates that more futures positions were being added while ARB was advancing. This has increased leverage within a market that has also experienced a substantial expansion in spot trading volume.
ARB’s price therefore combines a sharp spot-market advance with increased derivatives activity. At the same time, the RSI reading of 85.22 and the token’s position above the Upper Bollinger Band provide the key technical measurements cited for its current overbought condition.
FAQs
What is Arbitrum (ARB) trading at?
Arbitrum (ARB) was trading around $0.1946 to $0.1949 in the supplied market data.
What is the next major ARB resistance level?
The next cited Fibonacci resistance is $0.2189, corresponding to the 3.618 extension.
What are the key ARB support levels?
The $0.1814 and $0.1439 Fibonacci levels are the primary support areas identified after the breakout.



