

- Shiba Inu gained 14.8% in August and broke an 11-month bearish trend.
- SHIB holds above $0.00000525 while resistance remains near $0.00000574.
- September has a -2.99% median return that may affect the recovery.
Shiba Inu entered the final days of August with a stronger technical structure after recording the best August performance in its trading history, but the token is now approaching levels that could determine whether the recovery extends into September or gives back part of its recent gains.
SHIB is trading between $0.00000535 and $0.00000537 after gaining 10.15% over the past week, while its market capitalization is near $3.16 billion. The token has also retained a 14.8% monthly gain, according to the supplied TradingView data, as price remains above several short- and medium-term moving averages.
On the other hand, September tends to be a month with relatively low gains for SHIB, thereby shifting the emphasis to support near $0.00000525 and resistance ranging from $0.00000572 to $0.00000583.
Shiba Inu Consolidates Gains Above Major Moving Averages
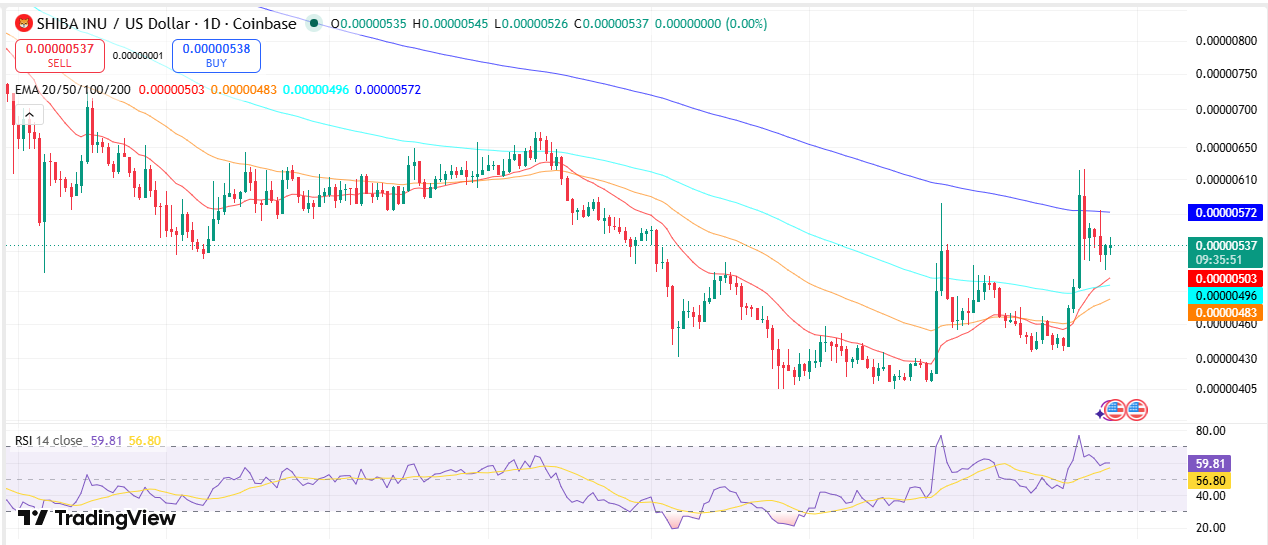
The daily chart of SHIB/USD on Coinbase sees the crypto holding above $0.00000536 while reversing from its prior lows. It trades higher than the 20 EMA at $0.00000503
The moving averages also offer multiple levels of support below the present market price. The 200 EMA on the other hand, lies much higher at $0.00000572 and acts as an important level of resistance. The price of SHIB had been rejected around $0.00000582 after making a bullish breakout attempt.
Source: Trading View
Moreover, momentum indicators also lie above the neutral zone. RSI is currently reading 59.55 against its moving average of 56.78. The indicator reading is below the 70 mark that indicates the overbought condition, while being above the moving average suggests the positive momentum at present.
Volume has been moving in the opposite direction from price. The 24-hour volume for SHIB has fallen by 16.42% to reach $82.14 million while still maintaining its week-to-week gains.
Shiba Inu Trading Within Fibonacci Levels
On the daily chart, we can see that the price is currently trading within certain Fibonacci levels. The Shiba Inu is now trading between the 0.5 level at $0.00000524 and 0.618 level at $0.00000544 having retraced back from an impulse wave to the 1 level at $0.00000612.
The 20-period SMA which is depicted on the middle Bollinger Band sits at $0.000004Price remains above that level while the Bollinger Bands are expanding following an extended period of lower price activity.
A move above the 0.786 Fibonacci level at $0.00000574 would put the upper Bollinger Band near $0.00000583 back into focus. A move through that area could place the $0.00000612 level on the chart as the next stated target.
Conversely, a decline beneath the 20-period SMA would expose lower support. The major support zone remains around $0.00000435, while the bearish scenario outlined in the supplied data places the summer lows near $0.00000430.
August Gain Record in Alignment with Seasonality of September
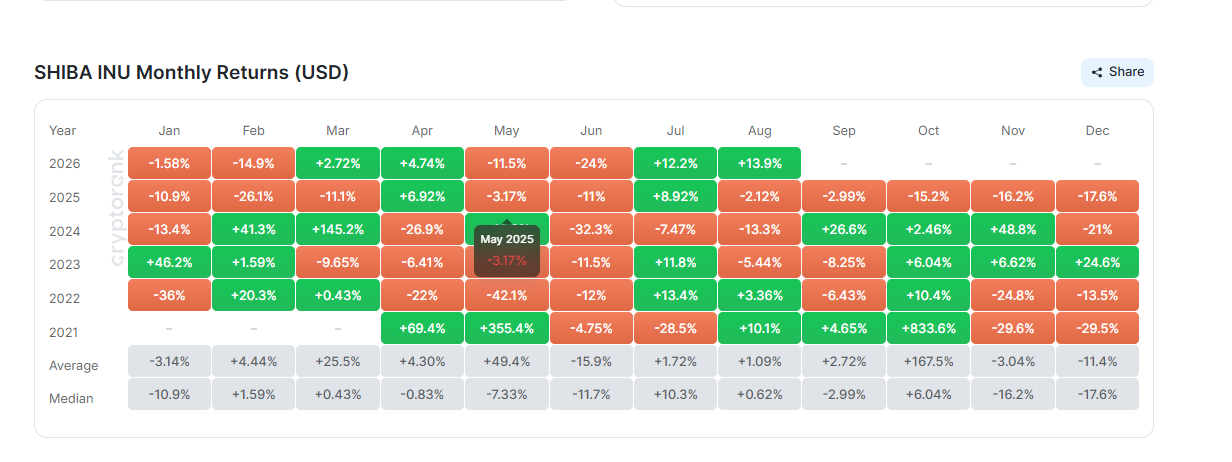
The results of this month have demonstrated a significant shift in the price behavior of SHIB. It rose by 14.8% and terminated an 11-month bearish period. This move also surpasses the token’s best August performance result of 10.1% in 2021.
Return for SHIB in Q3 of 28.1% compares with a median of 2.56% according to the provided information. The August advance followed a development in Japan on Aug. 21, when the country’s Financial Services Agency approved SHIB for listing on the licensed Laser Digital Japan platform, which is part of Nomura Group. The listing placed SHIB among six assets available to Japanese institutional investors.
The historical data also identifies September as a weaker period for the token.
Source: CryptoRank data
According to the supplied CryptoRank statistics, SHIB has not recorded a convincing positive September close in its trading history, while its median September return is -2.99%.
$0.00000525 Becomes a Key Level
The next phase of price action centers on whether SHIB can remain above $0.00000525. Such consolidation would allow maintaining the existing pattern of consolidation and keeping attention on those resistance levels above. A break below $0.00000525 could expose the lower support area around $0.00000430 to $0.00000435.
The supplied bearish scenario identifies this zone as a potential point at which the August advance could be substantially retraced.
The alternative scenario involves SHIB remaining above $0.00000525 while moving sideways. Within such a scheme, September would be considered a month of consolidation and not a more serious breakdown. According to the provided historical data, the median fourth-quarter return of SHIB is 20.3%.
FAQS
What is the current price of Shiba Inu?
The price of Shiba Inu is about $0.00000535-$0.00000537 according to the provided data.
What is the support level for SHIB?
The immediate support level for SHIB is $0.00000525, while the major one is $0.00000435.
What is the resistance level for SHIB?
The resistance levels include the 200 EMA ($0.00000572), and $0.00000583.



