

Cryptocurrency has undergone many cycles since its creation, whereby each cycle is identified according to the sentiments of the investors, market conditions, and the expansion of the crypto market sector.
All of these have affected the length of the bullish and bearish markets as well as the movements between high and low in the market price level of BTC. Cycles of accumulation, expansion, distribution, and decline characterize the cycles of BTC, though varying from one time to another.
This is evident in the historical prices of BTC. Bitcoin was priced at $19,665 at the end of December 2017 and $69,044 at the beginning of January 2021 and went on to close at $124,128 at the end of August 2025. BTC had to close at around $80,000 despite volatility and falling prices in August 2026.
Crypto Market Cycles Experience Evolving Phases
Accumulation usually takes place after major market falls or extended consolidation. Bitcoin’s 2018-19 period provides one example after BTC fell from nearly $19,700 in December 2017 to below $4,000 during 2018.
On-chain data can add context to these periods. Glassnode has examined realized profitability, spending behavior, and movements of older coins to assess changes in investor behavior. Such indicators describe market conditions but do not establish that a new bull market has started.
The expansion phase is marked by rising prices and stronger risk appetite. In Bitcoin’s 2017 market cycle, the final daily close was on Dec. 16, when the price was $19,665. In the 2020-21 market cycle, the final daily close
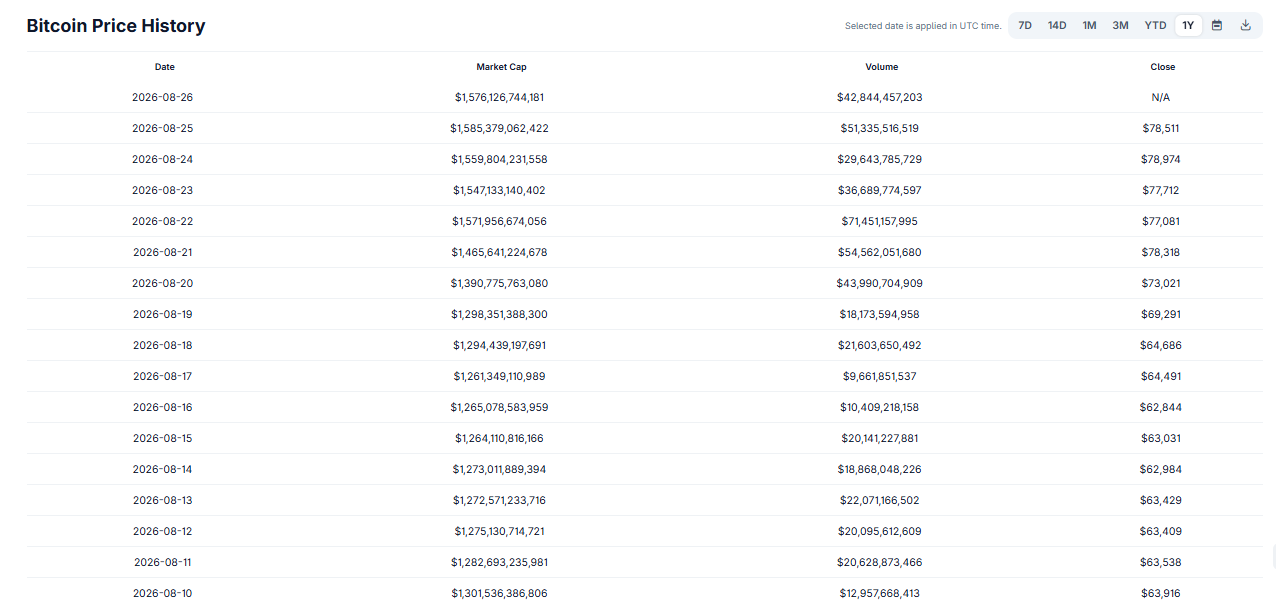
Source: CoinGecko
Unlike other cycles, the 2024-25 cycle was unique due to Bitcoin hitting a record price of $73,581 on Mar. 14, 2024, before the halving event in April. CoinGecko attributed part of the early advance to the launch of U.S. spot Bitcoin ETFs.
Distribution and bear markets follow different patterns
Distribution refers to periods when investors who accumulated at lower prices increasingly sell into demand. It may develop gradually rather than through one identifiable event.
Glassnode data indicated that long-term holders were allocating Bitcoin to the new demand, considering that the profit was above $2.1 billion. This was from the data collected in December 2024.
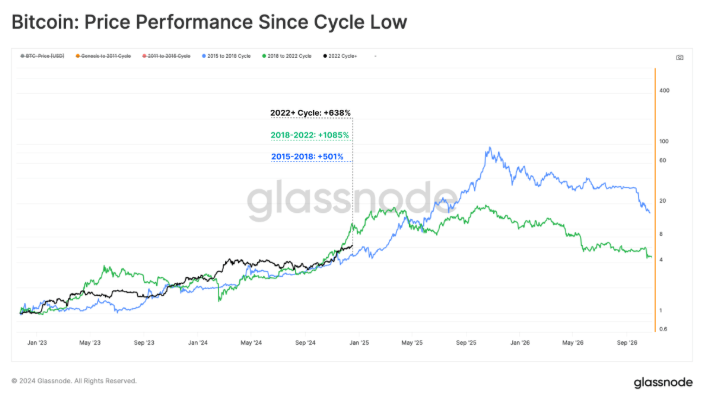
Source: Glassnode
A bear market means low prices, lower appetite for risks and, deleveraging, and low speculation. Under CoinGecko’s methodology, the 2018-19 bear market lasted 385 days and recorded an 83.6% maximum drawdown.
The 2022-23 bear market lasted 381 days with a 76.7% maximum drawdown. By comparison, CoinGecko reported a 51.2% maximum drawdown for the 2025-26 correction through June 24, 2026, based on the $124,773 high used in its analysis.
Bitcoin market cycles have become less uniform
Bitcoin’s successive cycles have produced different returns and structures. According to CoinGecko, the gains were estimated to be approximately 29 times between the halving in 2016 and the peak in 2017, 6.7 times between the halving in 2020 and the peak in 2021, and 93.1% between the halving in 2024 and the peak in 2025 during the report period.
However, the 2024-25 period was marked by another important structural shift in the form of the U.S. spot Bitcoin exchange-traded products. In fact, the Securities and Exchange Commission allowed several spot Bitcoin ETPs to be listed on Jan. 10, 2024, with trading starting on the next day. The trading volume on that first day was recorded as $4.6 billion.
Bitcoin’s record prices also vary between data providers. CoinGecko reports that the highest value of Bitcoin was $124,128 in August 2025. This disparity can be attributed to differences in the methodologies used in collecting the data and the coin’s intraday price of the coin.
In its report in April 2026, CoinGecko observed that all other post-halving cycle highs have happened around 12-18 months after the halving; however, this makes earlier four-year patterns less uniform.
Bitcoin dominance tracks capital rotation
Bitcoin dominance measures BTC’s share of total cryptocurrency market capitalization. Increased dominance might happen if Bitcoin beats other cryptocurrencies or if traders decrease their investments in small coins.
The dominance of Bitcoin was reported to be 56.8% by CoinMarketCap in September 2024, with an Altcoin Season Index of 29/100.
Altcoin season is a metric that shows the relative performance, not the stage of the Bitcoin cycle. BlockchainCenter describes altcoin season as a situation where at least 75% of the top 50 coins of the exchange have outperformed Bitcoin in 90 days.
Key takeaways
- Bitcoin’s major cycles have included accumulation, expansion, distribution, and prolonged declines.
- The 2024-25 cycle differed from earlier cycles because BTC reached a record before the 2024 halving.
- Bitcoin dominance and altcoins’ performances provide information on the capital rotation process but don’t establish exact cycles.
| Bitcoin cycle | Key price point | Maximum drawdown |
| 2017 peak | $19,665 | 83.6% |
| 2021 peak | $69,044 | 76.7% |
| 2025 high | $124,128 | 51.2% through June 24, 2026 |
Conclusion
The cycles in historical crypto markets form a model through which the market changes can be analyzed in terms of phases of accumulation, expansion, distribution, and downturn. However, the cycles observed in 2017, 2021, and 2024-25 illustrate how each cycle follows a different timetable.
These factors include institutional products, structural changes in the market, capital flows, and varying drawdowns.
FAQs
What are the main crypto market cycle phases?
Accumulation, expansion or bull market, distribution, and decline or bear market are typically the components of this framework.
What is the peak point of Bitcoin in the 2021 market cycle?
The peak point for Bitcoin was hit on November 10, 2021, when it touched $69,044, as per CoinGecko.
Does historical cycle analysis predict Bitcoin’s next move?
No. The supplied research shows that cycle timing, drawdowns and market structures have varied significantly.