
KEY INSIGHTS:
- Ethereum price monthly RSI is now lower than the 2018, 2022, and 2025 bear market bottoms.
- ETH trades at $1,797 with a 24-hour range of $1,760–$1,846 and $17.4B in trading volume.
- Analysts flag $1,400–$1,500 as the key accumulation zone after a confirmed 40% ETH crash.
- Long-term ETH price targets from analysts sit at $7,000, $10,000, and $15,000 per coin.
Ethereum Price Crashes 40% — Analysts Target $1,400 as the Cycle Bottom Zone
Ethereum price is drawing serious attention from analysts on June 16, 2026. ETH trades at $1,797, down 0.9% in 24 hours. The monthly RSI has dropped to historic lows, raising questions about a potential cycle bottom.
Monthly RSI Drops Below Every Major Bear Market Bottom
Ethereum price is now more oversold on the monthly RSI than at any recent bear market low. That covers the 2018 bottom, the 2022 crash, and the 2025 tariffs-driven selloff. Each of those levels marked generational buying entries before major recoveries.
Crypto Rover, a well-known market analyst, flagged this on X, writing: “$ETH monthly RSI just hit extreme oversold. More oversold than the 2018 bear market bottom. More oversold than the 2022 bear market bottom. More oversold than the 2025 tariffs bottom. Both of those marked generational entries. Both ran multiples from there. We are now lower than both on the monthly RSI. Insane to see this.”
What the RSI Reading Means for ETH
The RSI reading alone does not confirm a reversal. However, it does show that selling pressure has reached a historically rare extreme. Traders are watching this level closely for any sign of demand returning.
On CoinGecko, Ethereum price sits at $1,797.69, with a 24-hour range between $1,760.31 and $1,846.10. The market cap stands at $217 billion, while the 24-hour trading volume reaches $17.43 billion. Circulating supply holds at 120,684,109 ETH.
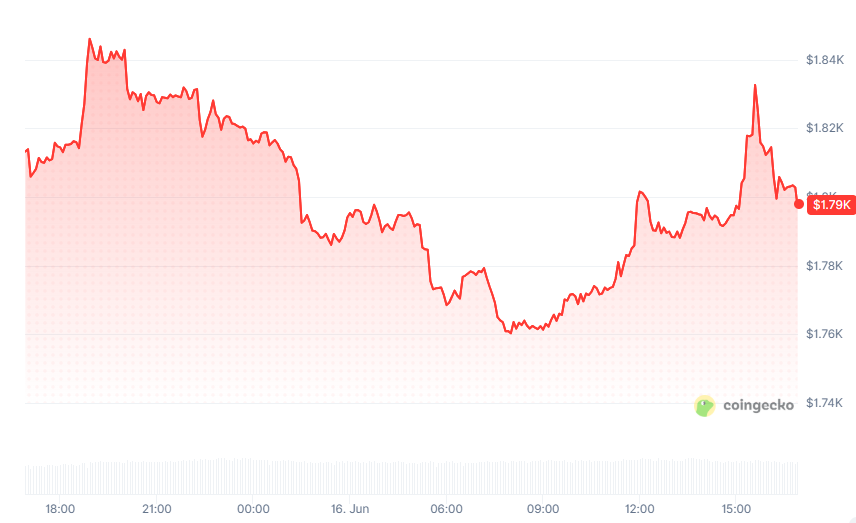
Source: Coingecko
Analysts Flag $1,400–$1,500 as the Critical Accumulation Zone
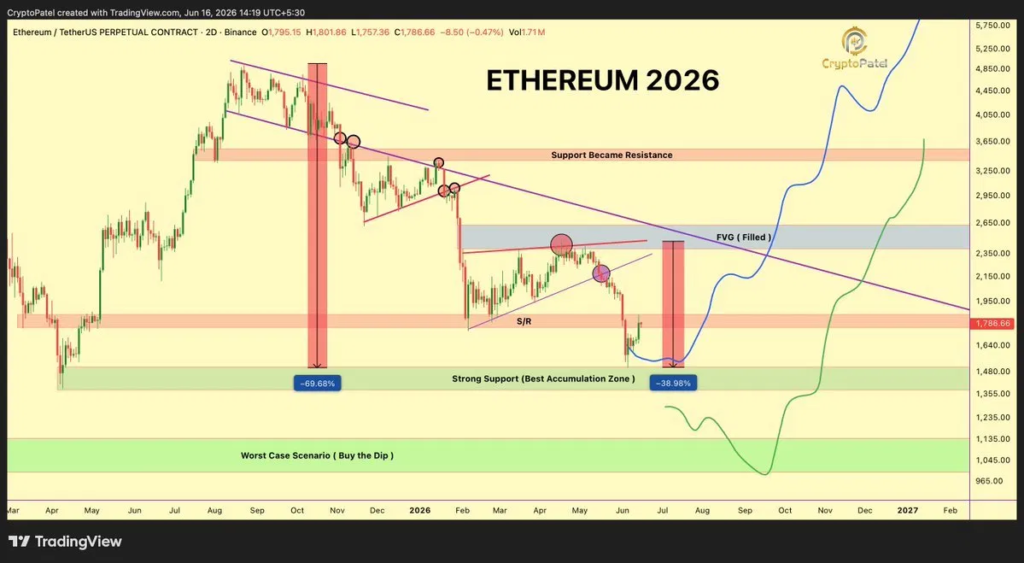
Crypto Patel, another widely followed analyst, warned about a 40% ETH crash when the price was trading around $2,300–$2,400. That target has now been reached. The analyst outlined a clear roadmap on X, writing: “When ETH was trading around $2,300–$2,400, I warned that downside was coming and mapped out the $1,400–$1,500 accumulation zone. Today, ETH has officially tagged that level. That’s nearly a 40% move from the warning.”
The same analyst noted that as long as the Ethereum price holds above $1,400, the cycle bottom may already be forming. A successful hold at that level opens a path toward a new bull cycle. Long-term price targets from the analyst include $7,000, $10,000, and $15,000.
Source: X
Downside Risk If $1,400 Breaks
Crypto Patel also addressed the risk scenario clearly. If the Ethereum price loses the $1,400 support and confirms a breakdown, the next major buying zone sits around $1,000. That level carries strong historical support and is seen as a high-probability accumulation zone if panic selling appears.
The analyst’s plan is still as simple as buying ETH every time there’s a significant drop in spot and building a long-term position. The long-term thesis is still the same regardless of the recent plunge.
Key Price Levels and Market Structure
The table below outlines the key levels analysts are watching for the Ethereum price:
| Level | Type | Notes |
| $1,846 | 24H High | Recent intraday resistance |
| $1,797 | Current Price | Down 0.9% in 24 hours |
| $1,760 | 24H Low | Short-term support |
| $1,400–$1,500 | Accumulation Zone | Key long-term buy area |
| $1,000 | Worst Case Support | Breakdown target |
| $7,000–$15,000 | Long-Term Targets | Bull cycle projections |
What Bulls Need to See Next
- A hold above $1,400 on the weekly close
- Volume confirmation during any recovery attempt
- Monthly RSI stabilization above current levels
- ETF inflows returning after weeks of outflows
- A clean daily close above $1,800 to improve short-term structure
The price of Ethereum is still facing selling pressure on the daily timeframe chart. But based on the historical RSI levels along with specific buy-side targets of traders, long-term holders can work around the defined plan.
Ethereum Price Outlook Heading Into the Second Half of 2026
The larger macro picture is another influence that helps guide the trajectory of the Ethereum price. The US-Iran peace deal that was publicized this week has served as a medium-term boost to the crypto markets. Bitcoin price opened on June 16th at $66,287, while ETH’s opening price was at a two-week high.
Despite the short-term lift, the Ethereum price still trades below its 20-day, 50-day, and 200-day EMAs. The MACD remains negative on the daily chart. The Crypto Fear and Greed Index sits at 23, which reflects extreme fear across the market.
The Long-Term Case Remains Intact
Institutional interest is also returning. Spot ETH ETF flows have flipped positive after weeks of redemptions. Whale wallets added $950 million worth of ETH through the recent decline. That kind of accumulation at these levels supports the analyst’s view that the Ethereum price may be near a long-term bottom.
The cycle thesis from analysts like Crypto Patel points to a significant recovery once the $1,400–$1,500 floor is confirmed. Until that happens, the Ethereum price action remains one of the most closely watched setups in the current crypto market.
Ethereum Fundamentals Remain Strong Despite Price Drop
The Ethereum network continues to process transactions daily despite the price decline. Developers remain active on the network, with upgrades still rolling out steadily. The circulating supply sits at 120,684,109 ETH, with no maximum supply cap in place.
Ethereum also holds the number two spot in the crypto market by market cap. Fully diluted valuation: $217bn. The staking feature still remains for ETH owners to lock up their ETH and yield on it and secure the network.
FAQs
Q1: What is the price of Ethereum today?
The price of Ethereum today is $1,797.69 (June 16, 2026), down 0.9% over the last 24 hours.
Q2: What’s the major support level of ETH right now?
The $1400-$1500 level is eyed as the primary accumulation zone and the support level of ETH right now.
Q3: Is the ETH monthly RSI at an extreme low?
Yes. The ETH monthly RSI is already lower than the lows from the 2018 bear market, the 2022 bear market, and the 2025 bear market.