Key Insights
- Ethereum price touched a low of $1,505 in June 2026, marking the deepest drop of the year before recovering to the $1,680 range.
- The current weekly support zone previously launched a +250% ETH rally, making the level one of the most watched on the long-term chart.
- Ethereum’s Stochastic RSI and MACD are both recovering from oversold lows, suggesting early signs of a potential shift in short-term momentum.
Ethereum Price Tests Key Weekly Support as Analysts Eye 250% Rebound Setup
Ethereum price is testing a major weekly support zone in June 2026, drawing attention from analysts across the crypto market. ETH dropped to a low of $1,505 before staging a modest recovery to around $1,681. Market watchers now track whether buyers can hold this zone and push ETH toward prior targets.
Ethereum Price Drops to $1,505, Then Bounces Back
Ethereum price fell sharply through May and into early June 2026. The sell-off pushed ETH down to a session low of $1,505, the weakest point recorded this year. Buyers stepped in near that level, and the Ethereum price recovered to around $1,681 by June 13.
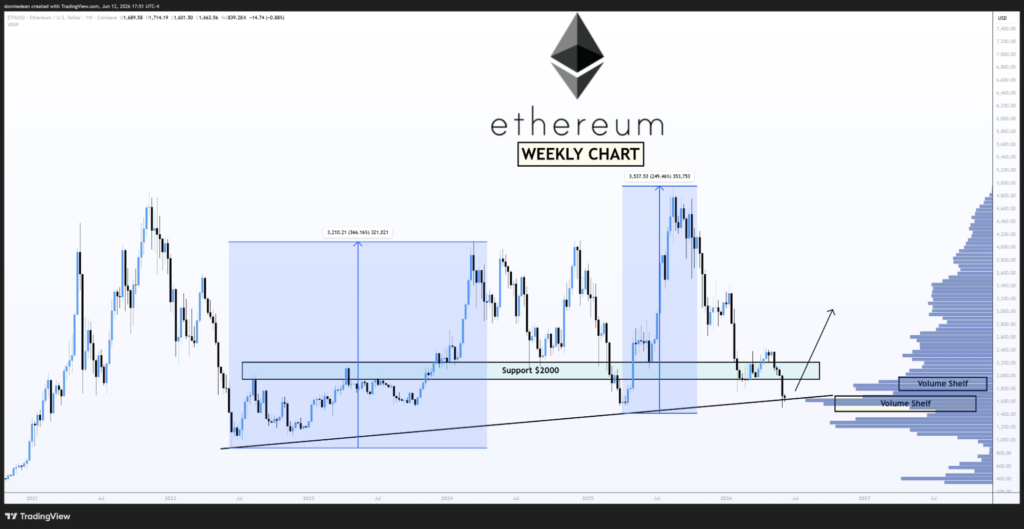
Crypto analyst Donald Dean shared a weekly chart of ETH on X, noting that the Ethereum price is “right at support.” Dean pointed out that the last time ETH traded at this zone, it went on to gain more than 250%. He also noted that Ethereum now has more real-world use cases and applications than ever before, yet the price is still testing the same long-term line.
What the Weekly Chart Shows About Ethereum Price
Long-Term Support Zone in Focus
The weekly chart shared by Dean shows a clear horizontal support area. This level has held through multiple tests over the past few years. Each time Ethereum price touched this zone, buyers returned and pushed ETH higher. The current test is drawing the same level of attention from long-term market participants.
 Source: X
The chart also shows that ETH has formed a pattern of lower highs since its prior peak. The Ethereum price has been trending down through 2026. However, the weekly support zone sits directly beneath where price is trading now, making this a key decision point for the asset.
Indicators Signal Early Recovery From Lows
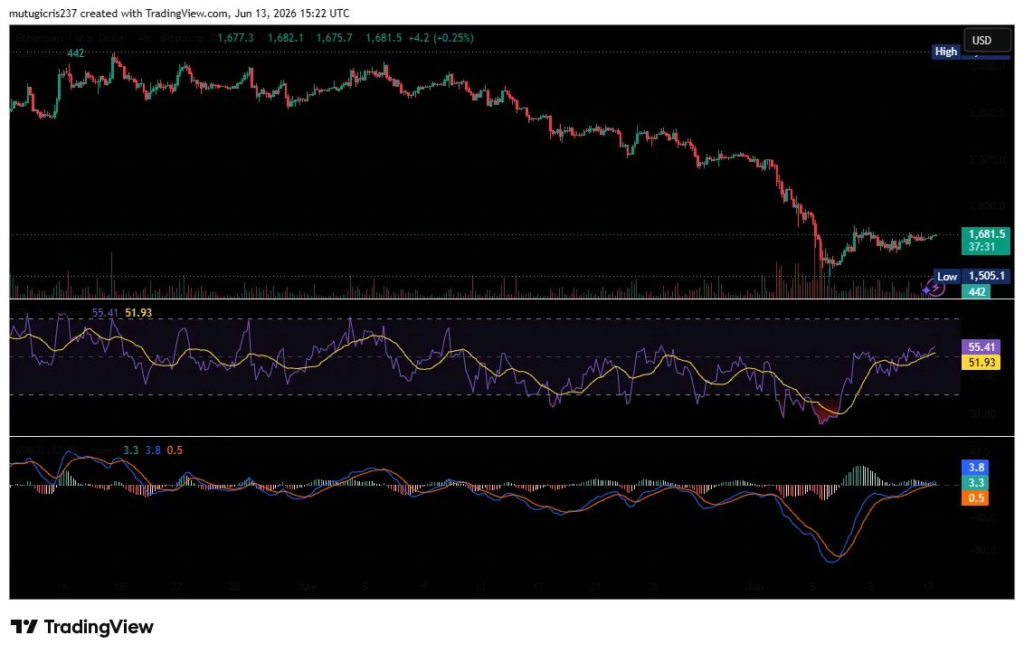
Looking at the daily chart on TradingView, the Ethereum price is showing early signs of a technical shift. The Stochastic RSI curled up from oversold after a sharp drop in late May. The main line sits at 51.93, the signal line at 55.41, both rising. That momentum shift matters.
 Source: TradingView
The MACD tells the same story. Histogram bars moved from deep negative to near flat, now reading 3.3 and 3.8. The signal line is at 0.5. Sellers are losing grip.
Neither indicator confirms a reversal on its own. Price needs to close above near-term resistance before this setup means anything.
ETH Price Levels Traders Are Watching
| Level | Price | Significance |
| Session Low (2026) | $1,505 | Year-to-date bottom, key demand zone |
| Current Price | ~$1,681 | Trading near short-term recovery zone |
| Near-Term Resistance | $1,700–$1,750 | First barrier for bulls to clear |
| Prior +250% Launch Zone | ~$1,505–$1,550 | Weekly historical support area |
| Recovery Target (if support holds) | $2,700+ | Long-term analyst base-case target |
The Ethereum price is currently sitting between the session low and the near-term resistance band. A sustained move above $1,700 would give bulls early confirmation that the weekly support zone is holding. A break back below $1,505 would change the short-term picture significantly.
Use Cases Grow as Ethereum Price Lags
Network Activity Continues Despite Price Drop
One point Dean raised stands out: the Ethereum network is more active and useful than at any prior point in its history. Developer activity, layer-2 adoption, and institutional use cases are all growing. Yet the Ethereum price remains near multi-year support rather than reflecting that growth.
This gap between network utility and price action is not unusual in crypto markets. Often, price lags behind adoption during bear phases, then catches up sharply once sentiment shifts. Traders watching the weekly chart are aware that a confirmed hold at this support zone could be the trigger for the next move higher.
Supply Data Adds to the Case for Buyers
Exchange data shows that the amount of ETH sitting on trading platforms has fallen to historic lows. More holders are moving ETH into staking contracts and private wallets.
Exchange supply is low. That means fewer coins are sitting ready to sell. When sellers step back, even modest demand can push the price hard.
The setup has three things going for it: thin supply, improving chart signals, and a support level that has held before. But none of that matters until price confirms. A daily close above $1,700 is the first test. After that, $1,750 is the wall to watch. Clear that, and the move becomes real.
FAQs
Q1: What is the current Ethereum price?
As of June 13, 2026, Ethereum price is trading around $1,681, recovering from a low of $1,505 recorded earlier in June.
Q2: Why is the current Ethereum price level important?
The current level matches a weekly support zone that previously launched a +250% ETH rally. Analysts are watching whether buyers can defend this area again.
Q3: What do the technical indicators say about Ethereum price?
The Stochastic RSI is rising from oversold levels, and the MACD histogram is recovering toward neutral. These signals suggest early momentum may be shifting, but confirmation is still needed.