

- Bitcoin has already broken below support levels as per the chart formations that have formed, pointing towards $54k as the next target level.
- According to Jiang Zhuoer, Bitcoin might bottom out between $42k and $44k in the final months of 2026.
- Glassnode’s MVRV Bands align with technical target levels and show two strong support levels of Bitcoin.
The issue of Bitcoin price predictions stayed in focus after the disclosure made by the Bitcoin mining head, Jiang Zhuoer, regarding the future of Bitcoin, in which he said that the next cycle bottom for Bitcoin would be somewhere between $42,000 to $44,000 in 2026.
The other set of predictions used technical analysis along with on-chain analytics and identified the $54,000 price level as an important support level for Bitcoin at the present time.
These forecasts were made amid Bitcoin prices of $62,000, marking a 51% fall from the highest prices recorded by Bitcoin in excess of $126,000 in October 2025.
While the forecasts have been derived using different approaches, they point to two levels that are being watched by market participants.
While the prediction by Jiang Zhuoer is based on the past market cycles and valuation of Strategy, the other one identifies the support at around $54,000 based on technicals and on-chain metrics.
Bitcoin Price Forecast from Trend of Strategy’s mNAV
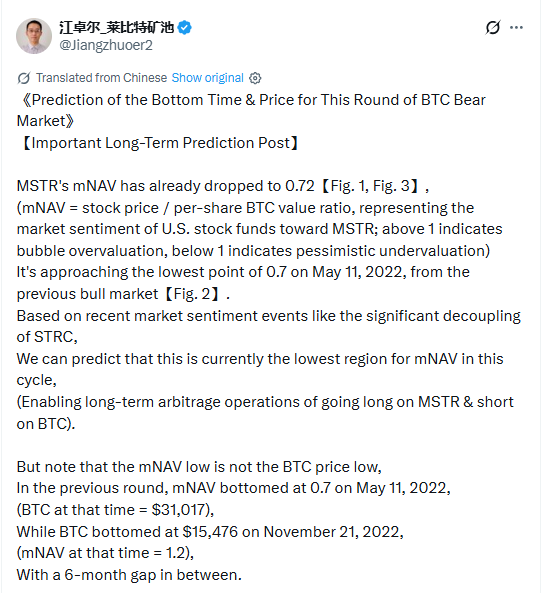
The BTC.TOP mining pool co-founder, Jiang Zhuoer, issued a market outlook on June 25 that tied Bitcoin’s future price action with Strategy’s market capitalization.
In his analysis, Jiang highlighted the company’s modified net asset value, or mNAV, that is used to measure how Strategy’s stock price stands up against the value of its Bitcoin holdings per share.
Source: Jiang Zhuoer
Based on Jiang’s analysis, the mNAV ratio for Strategy has fallen to 0.72. This number has been compared to the 0.70 figure from May 2022 when the previous crypto bear market occurred.
mNAV greater than 1 means that people pay more for the firm’s shares than its bitcoin holdings, while the opposite is true in the case of mNAV less than 1.Jiang said the current ratio places Strategy near the same valuation range observed during the previous market downturn.
He noted that the mNAV low in May 2022 occurred while Bitcoin traded near $31,000. Bitcoin later established its cycle bottom about six months afterward when the price declined to approximately $15,000.
Using that historical sequence, Jiang projected that a similar delay could place Bitcoin’s next cycle low between October and December 2026.
Based on that model, he estimated that Bitcoin could bottom in the $42,000 to $44,000 range.
Four-Year Market Model Backs Up Long-Term Outlook
Another four-year market model proposed by Jiang compares the price behavior of bitcoin with a bouncing ball that slowly diminishes its amplitudes.
The model states that the price fluctuations of the asset become less as the market capitalization grows. Under that framework, each market cycle produces lower relative volatility than the previous one.
His long-term Bitcoin price prediction therefore combines Strategy’s valuation trend with the historical timing observed during earlier market cycles rather than relying on short-term price movements.
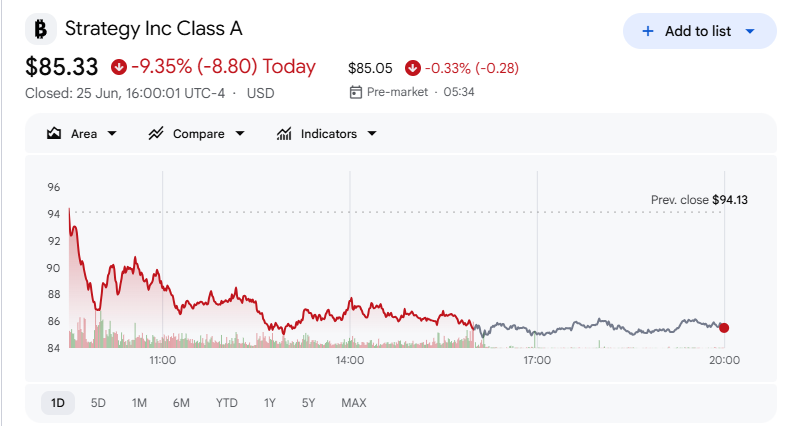
At the same time, Strategy’s recent share performance has remained part of the discussion. The stock of MSTR has recently gone down to the lowest since February 2024 and was priced at slightly above $94. Strategy’s preferred STRC shares also remained below their $100 par value, changing hands at $80.84.
Jiang stated that the weakness in those securities has contributed to current market stress.
Source: Google Finance
He also noted that other analysts have suggested continued pressure on Strategy’s capital structure could eventually raise questions about future Bitcoin holdings.
Technical Patterns Identify $54,000 Support
Separate technical analysis presented a shorter-term outlook based on chart formations rather than market cycles.
Bitcoin fell below the psychological $60,000 level after broader weakness in large-cap technology stocks weighed on investor sentiment.
During Thursday’s trading session, the cryptocurrency declined as much as 4.8% and briefly traded near $58,000, removing its gains recorded during June.
Source: Trading View
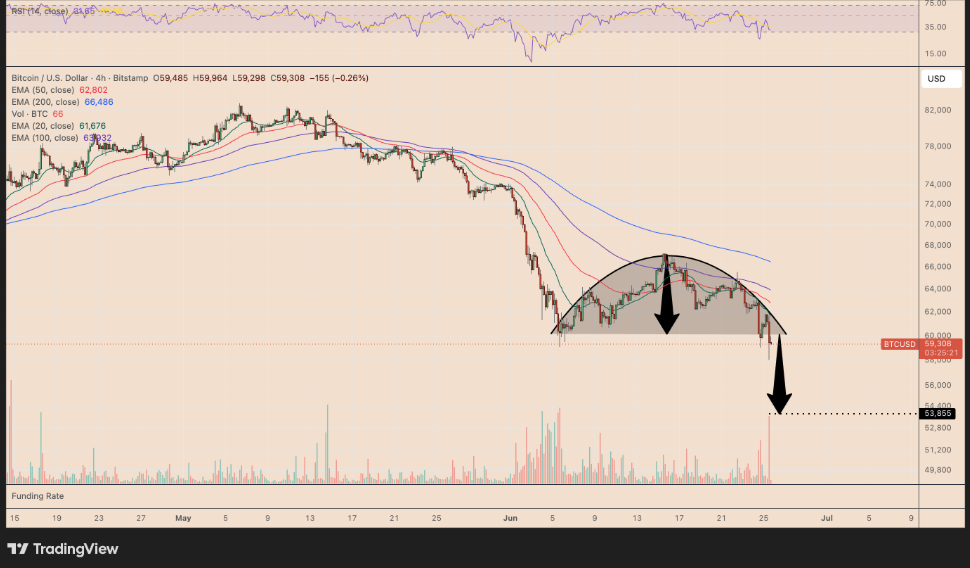
The decline also completed what technical analysts described as a rounded-top formation on the four-hour chart.
A rounded top develops when buying momentum gradually weakens before the market transitions into a downward trend. The pattern is considered complete after the price breaks below its support level, commonly known as the neckline.
Using the measured-move method associated with that pattern, analysts calculated a downside objective just below $54,000.
Daily price action also produced a bear flag breakdown, a separate technical formation that projected nearly the same target.
Because both chart patterns indicated support around the same level, the analysis identified the $54,000 area as an important price zone in the current market.
Bitcoin Price Forecast Consistent With On-Chain Indicators
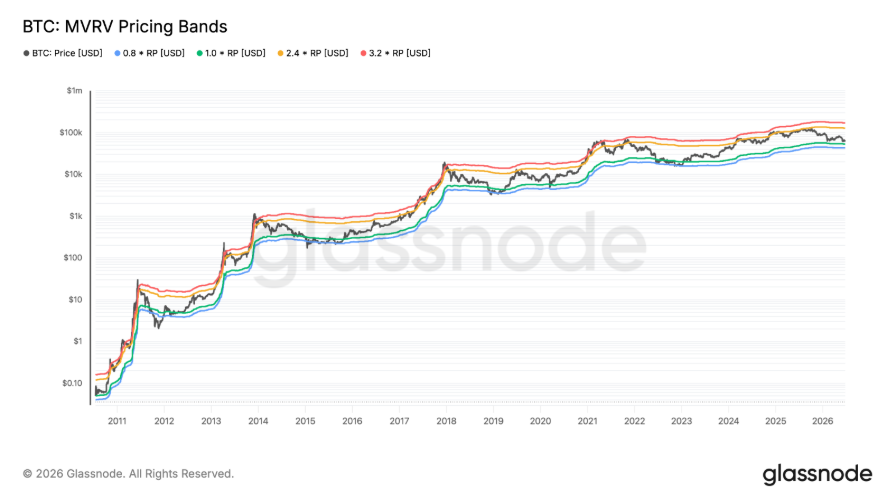
On-chain metrics too pointed towards similar support areas. The MVRV (Market Value to Realized Value) Bands by Glassnode compare Bitcoin’s current market value against its average price during the most recent transaction on the blockchain.
At the time of the analysis, Bitcoin was trading at about $60,997, whereas the 1.0 MVRV Band was at $53,390. Both these readings were near the target at $54,000 that was pointed out both by the rounded top and the bear flag patterns.
Source: Glassnode
In addition, the study focused on another price area of the 0.8 MVRV, which was near $42,700.
Historically, major Bitcoin bear-market lows have developed near that level during periods of elevated unrealized losses across the network.
That figure also closely corresponds with Jiang’s projected $42,000 to $44,000 range.
The combination of technical analysis, on-chain valuation bands, and Jiang’s cycle model therefore identifies two primary areas currently discussed in the market.
The first one is the area of $54,000 that is indicated by chart patterns as well as the 1.0 MVRV pricing zone, whereas the second area is between $42,000-$44,000 and is supported by the Jiang’s historic cycle as well as the 0.8 MVRV pricing zone.