Key Insights
- Bitcoin remains stable above $63K as buyers continue to defend the critical $60,000 level of support.
- Institutional demand stays healthy, with Strategy adding 1,550 BTC to its existing sizable stack.
- ETF flows, inflation data, and decisions from the Fed may determine Bitcoin’s next significant price movement.
Bitcoin hovered near $63,000 Tuesday after a massive sell-off briefly sent the cryptocurrency below the key support of $60,000. Short-term momentum appears to be subdued as investors focus on institutional demand, ETF flows, and key technicals as the currency looks to establish a floor.
Bitcoin Finds Support as Market Searches for Stability
Bitcoin traded sideways over the past sessions between $62k and $64k, as it experienced one of the steepest drawdowns of the year. This recovery has been initiated by bulls stepping in around the $60k area, saving it from deeper drops.
Overall, the current structure seems rather ambiguous. From a weekly point of view, BTC remains above its long-term 200-week moving average near $52,835, while the 50-week MA, located around $76,826, has begun to flatten due to a loss in price momentum.
Crypto Birb, another crypto-analyst, made an explanation on his recent post in X of why many are still discussing the 200-week simple moving average.
According to Birb, the indicator simply shows the average of weekly closing prices during a time period of around four years and inherently tends to rise due to BTC’s past performance.
The indicator should not be relied on solely, because although it serves as a psychological support in bear market environments, it takes past cycles into account and not the price trajectory of the future.
Key Bitcoin Technical Levels
| Level | Price |
| Current BTC Price | $63,000 |
| Immediate Support | $60,000 – $62,000 |
| First Resistance | $64,000 |
| Second Resistance | $68,000 |
| 50-Week Moving Average | $76,826 |
| 200-Week Moving Average | $52,835 |
Key areas traders are monitoring include the following:
- Support between $60,000 and $62,000
- Resistance near $64,000
- Higher resistance around $68,000
- Long-term support near the 200-week moving average
Institutional Demand Continues Supporting Bitcoin
Corporate Accumulation Remains Active
The core of data continues to support Bitcoin despite the recent dip in the chart.
Perhaps one of the biggest news items during the pullback was that Strategy, the company, announced a purchase of 1,550 Bitcoin for $101 million. The company is now the holder of 845,256 Bitcoin, and the company is notorious for continuously accumulating the digital asset since the beginning.
Large institutional buying usually sparks demand for the asset as it reduces supply on the market. When these entities continue to stack up, they tend to bring stability back to investors’ sentiments during volatilities.
At the same time, the long-term supply of Bitcoin has not changed. The supply of Bitcoin is limited to 21 million, and it’s always a big factor for investors that are looking for scarce assets.
ETF Flows and Macro Conditions Shape Market Direction
Additionally, the market participants are monitoring flows in spot Bitcoin ETFs after SoSoValue data correlated the recent decline to the removal of around $5.4 bn. ETF flows have become one of the most crucial variables that drive Bitcoin prices over the last two years.
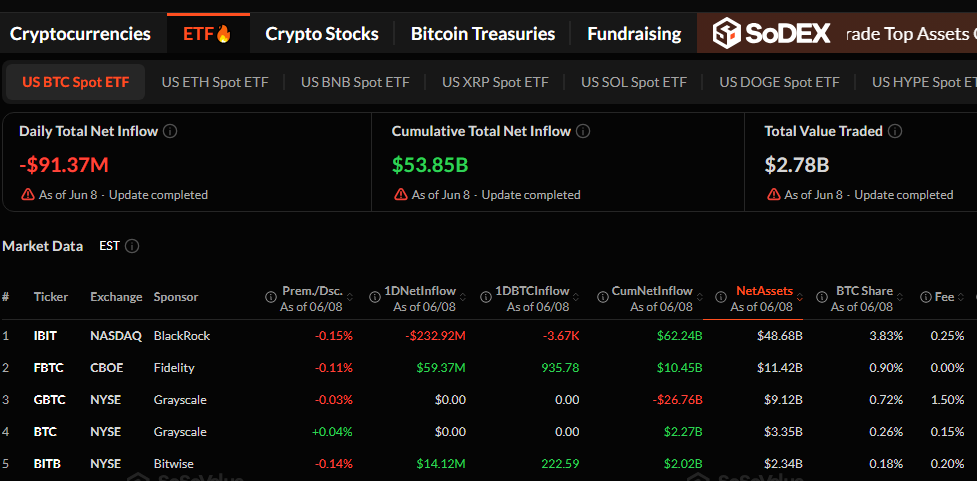
Source: Sosovalue
High ETF inflows generally lead to more buying pressure on the asset, while consistent outflows could be a source of additional selling pressure on Bitcoin.
Market participants are now awaiting the release of recent U.S. inflation figures, as well as the monetary policy of the Fed. Lower readings would lead to increased risk appetite on financial markets, while restrictive monetary policy could continue to pressure speculative assets.
Momentum Remains Weak but Selling Pressure Shows Signs of Easing
RSI and MACD Signal a Market in Transition
It still appears to be a recovery rather than a firm bull market in the short term, however.
The RSI recovered from oversold recently but is still under 50 (neutral), so the buyers have had some of their say back, but momentum hasn’t turned around.
The MACD has had a recent bullish cross, but the indicator is still below 0, as are both lines, so again, the move back up has been tentative at best.
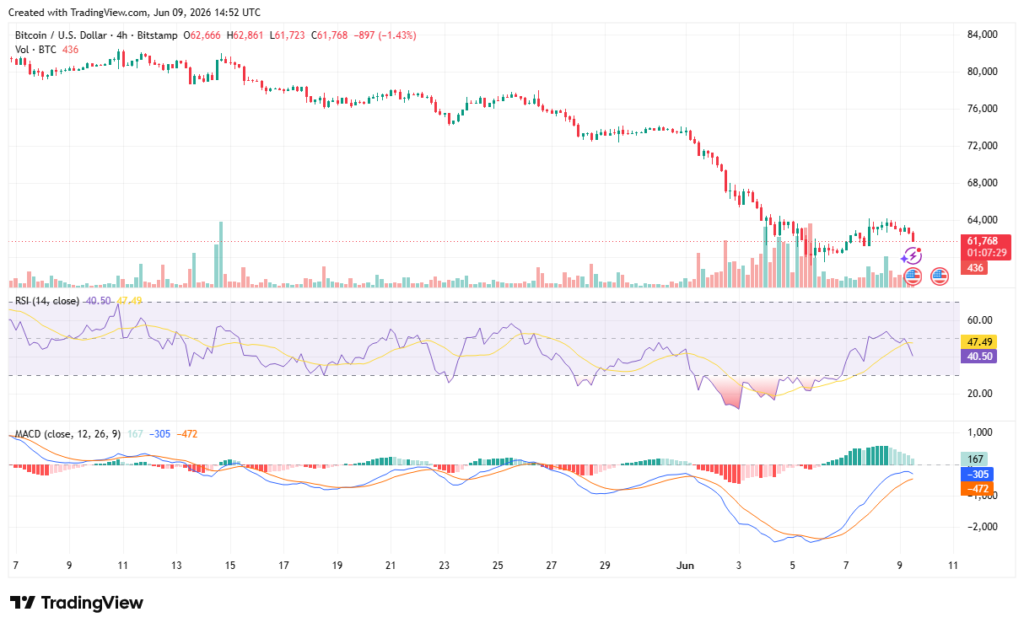
Source: TradingView
Other sentiment indicators also reflect caution across the market:
- Fear and Greed Index remains at 14
- Volatility has declined from recent highs
- Trading volume increased during the sell-off
- Buyers continue defending major support levels
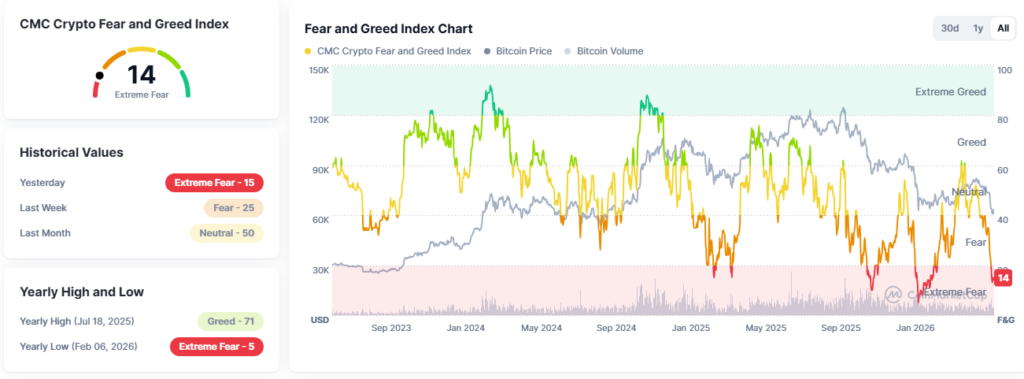 Source: Coinmarketcap
In the short term, BTC needs to be able to find support above 60k and push past resistance levels at 64k and 68k. If institutional buying, strong ETF demand, and favorable macroeconomics continue to build, it’s likely we will see an attempt at recovery; however, if we cannot hold support, it is probable the market will weaken again prior to a stronger trend.
FAQs
- Why is Bitcoin holding above $63K?
Strong buying interest and institutional demand are supporting the price. - What is Bitcoin’s key support level?
The main support zone is between $60,000 and $62,000. - Why are Bitcoin ETFs important?
ETF inflows and outflows can significantly influence market demand. - What is the next resistance level for Bitcoin?
Traders are watching $64,000 and $68,000 as key resistance levels.