Key Insights
- The price of Bitcoin managed to rally above $63K after a significant drop that pushed its price to just below $60K during Thursday’s trading session.
- Strategy managed to acquire 1,550 Bitcoin at $100 million, which assisted in building market sentiment during the volatile period.
- Bitcoin Price Recovery depends on the ability to maintain the $62.8K support level and on future U.S inflation data releases.
On Monday, Bitcoin turned higher and climbed above the $63,000 mark, following a sharp decline that at times had the asset at the lowest of 2026. Easing of geopolitical worries coupled with further institutional buying supported the move, but it was ETF flows, inflation, and Federal Reserve policy that were firmly in the eyes of traders.
Bitcoin Rebounds After Sharp Market Selloff
On Friday, Bitcoin dropped to as low as $59,108 before regaining about $63,116. This liquidation caused massive liquidation all across the crypto market; $1.75 billion was wiped out during the event.
However, Bitcoin has recovered over the weekend. Sentiment began to rebound after reports on the possibility of a ceasefire deal in the Middle East were published.
With improved risk sentiment, Bitcoin is buying in and climbing back over $63,000.
Ali Charts Identifies Long-Term Bitcoin Support Levels
Crypto analyst Ali Charts, in a post, shared what investors should be looking for as they DCA Bitcoin before the next bull run.
The post indicated that the analyst was watching the 200-week simple moving average ($62,800) as well as the 300-week simple moving average ($55,000) and 400-week simple moving average ($42,500).
The chart showed that Bitcoin was still above all three long-term moving averages despite the latest pullback. He stated that the overall structure of the market remained bullish while the support regions held.
Key Long-Term Bitcoin Support Levels
| Indicator | Level |
| 200-Week SMA | $62,912 |
| 300-Week SMA | $55,000 |
| 400-Week SMA | $42,500 |
Key observations from the chart:
- Bitcoin remains above all major weekly moving averages.
- The 200-week SMA continues to trend higher.
- The 300-week SMA acts as secondary support.
- The 400-week SMA remains the deepest long-term support zone.
- The broader structure remains positive while support holds.
https://x.com/alicharts/status/2063871011322302524?s=20
Strategy Purchase Eases Investor Concerns
In addition, market sentiment rose following a new purchase of Bitcoin from Strategy. Earlier jitters were due to a reported sale of 32 BTC worth around $2.5 million from Strategy.
It raised investor concerns since the company has a very poor record of selling Bitcoin. Spreading quickly across the market, it added pressure on Bitcoin during the latest drop.
Those jitters subsided, however, once Strategy announced that they purchased $100 million more of Bitcoin. The purchase added about 1,550 BTC to their portfolio. It increased confidence among market participants eager for clues about institutional demand.
The price of Bitcoin moved up in reaction. Traders interpret the buy as proof of active corporate buyers despite the market’s turbulence.
ETF Outflows and Economic Data Remain in Focus
Despite Bitcoin’s recovery, flows into institutional funds remain an obstacle. The flows into spot Bitcoin exchange-traded funds have seen net outflows of $1.72 billion between June 1 and June 5.
The biggest portion of the outflow is said to be into the IBIT of BlackRock. The fund had seen withdrawals of $1.34 billion.
In the meantime, investors are watching the economic data release from the U.S closely, after a higher-than-expected jobs report; investors now believe the interest rate would stay higher for longer than we estimated.
Several major events could shape the next move for Bitcoin:
- June 10 Consumer Price Index report.
- June 17 Federal Reserve meeting.
- Additional updates on ETF fund flows.
- Developments in global geopolitical conditions.
Technical Levels Remain Critical
Bitcoin continues to move sideways as traders gauge sentiment. Technical analysts point to the region between $63,450 and $64,000 as immediate resistance.
If price is able to clear these levels, we could see further strengthening of short-term momentum and a rise in buyer interest.
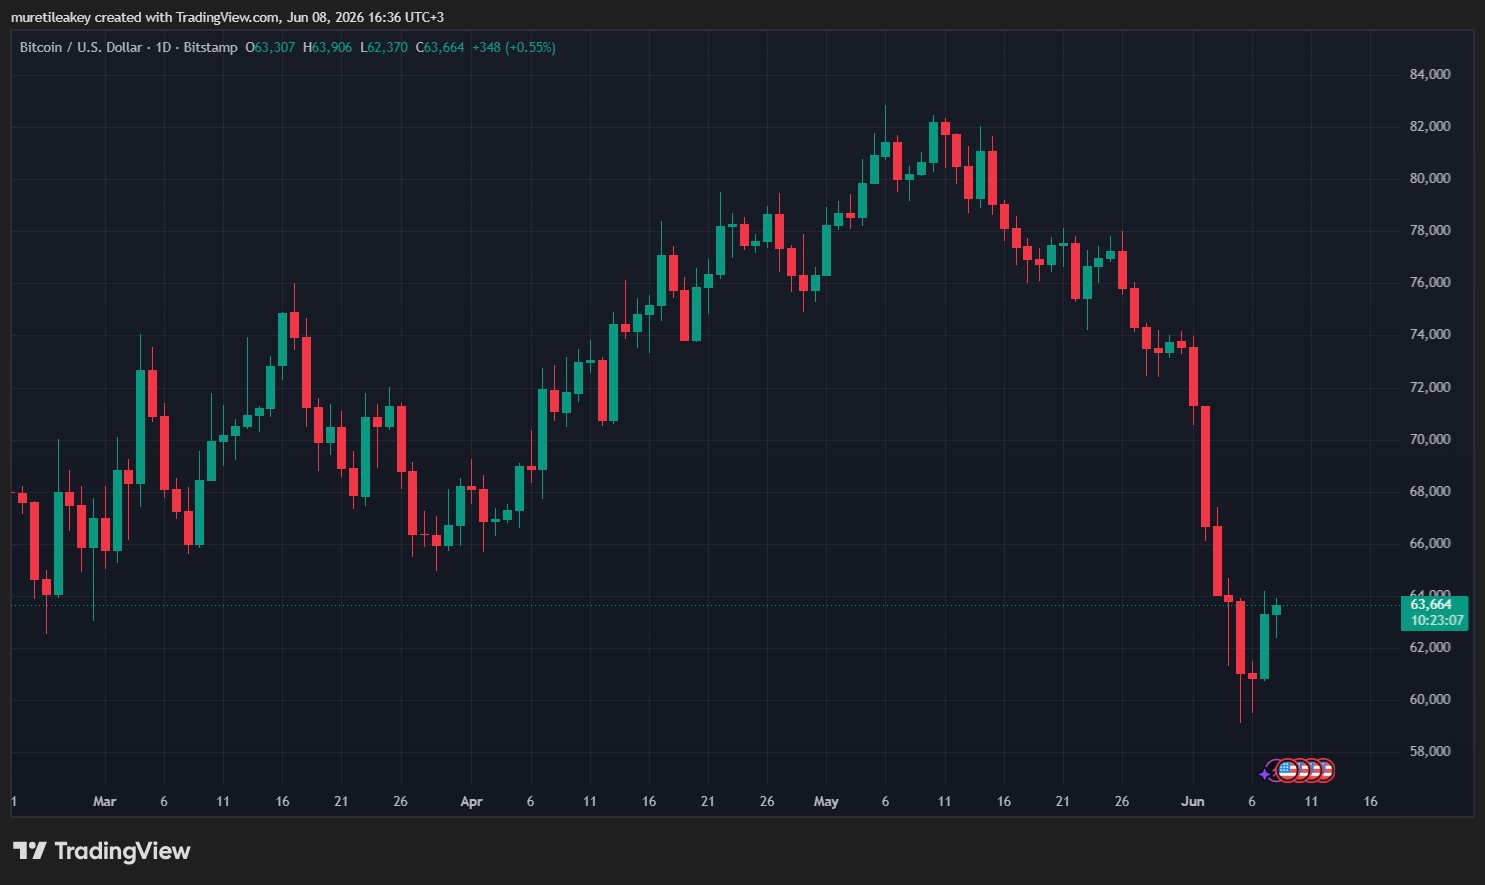
Source: TradingView
Below us, support exists in the region between $60,000 and $61,500. Market players are also keeping an eye on the most recent swing low at $59,108.
If price falls through that level, we could see sellers pile into Bitcoin, pushing price toward lower support levels.
For now, Bitcoin is still above the most significant long-term moving averages; however, traders will be keeping an eye on Macro trends, institutional flows, and price action for directional clues.
FAQs
- Why is Bitcoin recovering above $63,000?
Bitcoin is recovering due to improved market sentiment, easing geopolitical concerns, and Strategy’s $100 million Bitcoin purchase. - What is the most important Bitcoin support level right now?
The key support level is the 200-week SMA near $62,800, which many analysts view as a major long-term trend indicator. - How do Bitcoin ETF outflows affect the market?
Large ETF outflows can signal reduced institutional demand and may create short-term selling pressure on Bitcoin prices. - What levels should traders watch next for Bitcoin?
Traders are watching resistance between $63,450 and $64,000, with higher targets at $80,000 and $95,000 if momentum continues.