Key Insights
- BNB dropped 5.73% to $570.31, with sellers firmly in control above the $600 level.
- Stochastic RSI and MACD both signal oversold, but momentum remains pointed downward.
- Grayscale’s GBNB ETF filing gives BNB a long-term boost if the $566 floor holds firm.
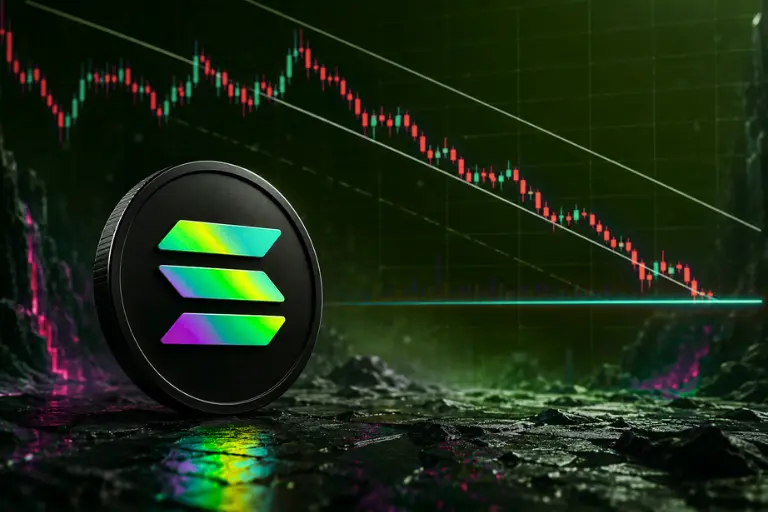
Binance Coin (BNB) is having a rough start to June 4, 2026. The token slid 5.73% from its session open, hitting a low of $570.31 and threatening a key demand zone that bulls have leaned on for months. With BNB unable to stay above $600, sellers are firmly in charge and the pressure is not letting up.
BNB Breaks Below $600 as Selling Pressure Mounts
BNB opened the June 4 session at $604.98, but sellers wasted no time taking control. Price quickly collapsed to a session low of $570.31, setting off a wave of liquidations across the broader market. As of this writing, BNB has clawed back to $599.92, attempting a modest recovery, though the bounce looks fragile at best.
Volume told the real story on that low candle, spiking to 19.49K and confirming that sell-side conviction remains strong. The outlook for BNB has turned cautious as price repeatedly fails to close back above $600. Until bulls can put in a decisive candle above that level, the path of least resistance stays to the downside.
Adding some context to the move, Binance dropped a notable platform announcement on June 3, 2026:
“To provide a more seamless Web3 experience, we are upgrading the Binance NFT service to be made available on Binance Wallet. Users who hold transferable NFTs on Binance Exchange must withdraw by July 3, 2026.” — @binance
https://x.com/binance/status/2061967398715240622?s=20
The post racked up 64,600 views within hours. While the NFT migration is framed as a product improvement, it introduces a layer of short-term friction. On-chain demand for BNB utility could soften temporarily as users navigate the transition window.
Technical Indicators Signal Continued Weakness
Stochastic RSI Dips Deep Into Oversold Territory
The daily Stochastic RSI is not painting a pretty picture for BNB bulls. The %K line is at 27.69 and %D sits at 33.91, both sitting below 30. That is deep oversold territory by any measure.
Now, oversold does not automatically mean a bounce is coming. Both lines are still trending lower, which tells you sellers are not done yet. Until one of them curls back above 30, there is no real reason to expect momentum to shift. A crossover back above 30 would be the first meaningful sign that sentiment is beginning to shift.
MACD Confirms Accelerating Bearish Momentum
The MACD is not offering bulls much comfort either. The MACD line sits at -20.95, the signal line at -14.27, and the histogram reads -6.67. That gap between the two lines has been widening sharply over the past two weeks, a clear sign that downside momentum is picking up rather than fading.
There is no bullish crossover in sight without a meaningful catalyst stepping in. In the interim, traders should keep an eye on $604.98 as the first real resistance level on any bounce attempt.
| Indicator | Reading | Signal |
| Stochastic %K | 27.69 | Oversold |
| Stochastic %D | 33.91 | Oversold |
| MACD Line | -20.95 | Bearish |
| Signal Line | -14.27 | Bearish |
| Histogram | -6.67 | Expanding Bearish |
| Session Low | $570.31 | Key Support |
| Session Open | $604.98 | Near Resistance |
Key Price Levels and Institutional Outlook for BNB
Support Zone at $569.76 Remains the Line in the Sand
The $569.76 to $570.31 area is the most important zone on the chart right now. It lines up with the February 23, 2026 swing low of $566.46, a level that held firm for months without being seriously challenged until now.
A daily close beneath $566 would break this structure entirely. From there, the next meaningful area of support does not show up until the $500 to $470 range, where mid-2024 volume left a notable footprint. Bulls need to step up and defend this floor aggressively, or a deeper correction becomes increasingly likely.
Grayscale ETF Filing Provides a Structural Tailwind
On the institutional side, there is a more optimistic development worth noting. Grayscale recently filed its third S-1 amendment with the SEC for a BNB ETF under the ticker GBNB, moving the product closer to becoming a reality for traditional finance investors.
If approved, a spot BNB ETF would follow the same playbook as the Bitcoin and Ethereum ETFs, both of which drew significant capital inflows following regulatory clearance. Layer that on top of BNB’s ongoing token burn mechanism, and the structural demand case starts to look compelling. Should bulls manage to reclaim $636, analysts see a path toward the $690 to $736 range within June 2026.
Broader Market Sentiment Leans Cautiously Bullish
The optimism is not limited to institutional filings. Crypto commentator @CryptoPatel raised an interesting question on X that caught significant attention, asking whether BNB might never trade this low again in 2026.
https://x.com/CryptoPatel/status/2062376295892127919?s=20
The post, which gathered 17K views, was accompanied by a long-term chart mapping multi-year support levels dating back to 2024, framing the current zone as a potential macro floor rather than the beginning of a deeper breakdown.
While that remains an opinion rather than a forecast, it reflects a growing school of thought that the current selloff is creating value at levels that may not return for some time. Whether that thesis holds depends entirely on bulls defending the $566 floor in the sessions ahead.
Key BNB Price Levels to Watch
- Support: $569.76 / $566.46 (February 2026 low)
- Breakdown target: $500 to $470 (mid-2024 volume support)
- Near resistance: $604.98 (session open)
- Recovery targets: $636 then $652 then $690 to $736
FAQs
What is the most important support level for BNB right now?
The $569.76 to $570.31 zone is the critical floor. A daily close below $566 opens the door to a drop toward $500 to $470.
Could the Grayscale BNB ETF filing reverse the decline?
Not immediately. The GBNB filing is a long-term catalyst. Short-term price action will continue to be driven by technical and broader market sentiment.