

- Bitcoin was trading around $65600 and remained above the important support level amid neutral momentum.
- The inflows in Bitcoin ETFs were close to $1 billion in just seven trading days.
- Bitcoin tested the resistance level at $66900, and open interest remained higher despite price consolidation.
Bitcoin price prediction became relevant once again as the cryptocurrency approached the $65,600 level amid subdued trading sessions and despite the ongoing selling pressure below the current highs.
Even though Bitcoin was unable to hold above the $66,000 mark on the day, there were certain technical signs that indicated that the overall market structure remained sound. In the meantime, the inflows of spot Bitcoin ETFs listed on the U.S. stock exchanges continued for a record of seven sessions, reaching almost $1 billion.
Bitcoin Price Prediction Displays Range-Bound Movement Below Resistance
The price of Bitcoin reached $65,603.34, which represents a drop of 0.5% from the levels seen on the prior trading day. The market cap of the asset was at $1.31 trillion, whereas the daily trading volume declined by 23.4% to $24.12 billion.
From the hourly chart, Bitcoin showed signs of multiple failed attempts to reach $66,000 again but eventually managed to fall back to the $65,400 zone due to sellers. In spite of the cryptocurrency’s recovery, trading remained within the limited intraday range.
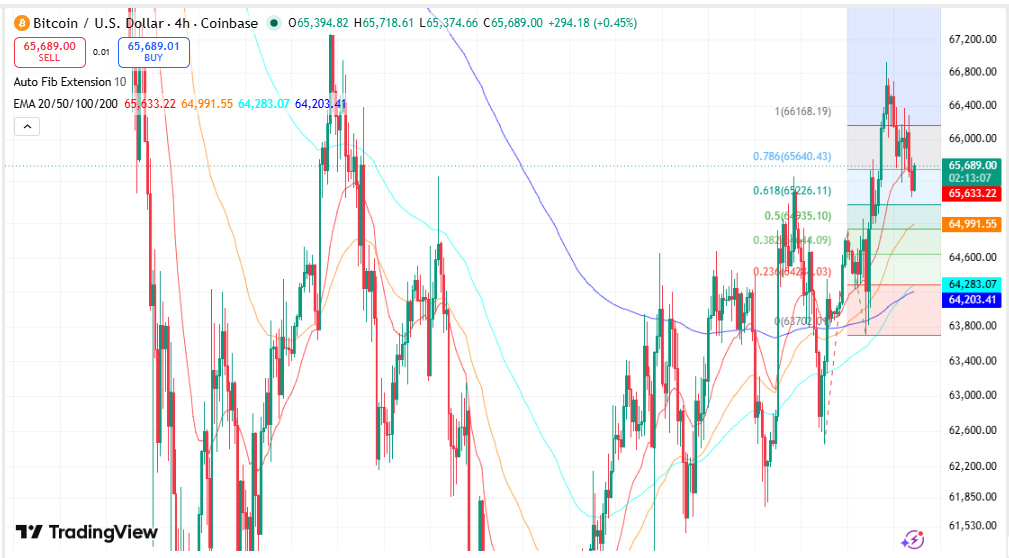
Moreover, from the four-hour chart, Bitcoin was trading near $65,604, above the 100-period EMA of $64,281 and the 200-period EMA of $64,203, respectively. The said levels served as the main trend lines despite the recent weakness.
Source: Trading View
Bitcoin was trading slightly below the 20-period EMA of $65,625 as a result of short-term selling pressure due to the rejection near $66,700. The 50-period EMA of $64,988 was the closest dynamic support line for the crypto pair at the moment. The RSI stood at 52, down from 60.36 previously.
Levels of Importance to Monitor for Bitcoin
A number of key technical levels remain important to the technical structure of Bitcoin’s present trading range.
- Resistance comes in between $66,560 and $66,924, while a recent swing high of $66,168 acts as a critical resistance level.
- Support comes in between $64,988 and $65,026, while a key floor comes in at $63,702.
- The RSI is neutral at 52 as Bitcoin trades above its long-term moving averages.
Bitcoin held above the 0.618 Fibonacci retracement level at $65,026, which implies that buyers were defending higher retracement support.
The Bollinger Bands also indicated that price was moving in a normal level of volatility. Bitcoin was trading at around $65,661 after bouncing off the middle Bollinger Band which was at $65,759. The upper Bollinger Band was still at $66,917, while the lower one was at $64,602.
Bitcoin Market Snapshot
| Metric | Latest Reading |
| Bitcoin Price | $65,603.34 |
| 24-Hour Change | -0.5% |
| Market Capitalization | $1.31 Trillion |
| 24-Hour Trading Volume | $24.12 Billion |
| RSI (4H) | 52 |
| 20 EMA | $65,625 |
| 50 EMA | $64,988 |
| 100 EMA | $64,281 |
| 200 EMA | $64,203 |
| Key Resistance | $66,560–$66,924 |
| Key Support | $65,026 / $63,702 |
ETF Inflows Continue Supporting Market Activity
Institutional investment products continued recording positive flows despite Bitcoin remaining below recent highs.
According to SoSoValue data, U.S. spot Bitcoin ETFs registered $68.99 million in net inflows on Wednesday. That lifted cumulative inflows since July 14 to $999.38 million, extending the streak to seven consecutive trading sessions.
Although Wednesday’s inflows were lower than Tuesday’s $203 million, the current streak continued building despite Bitcoin trading below $66,000. The previous record occurred in April when spot Bitcoin ETFs attracted approximately $2.1 billion across nine consecutive sessions.
At publication, Bitcoin traded near $65,729, while the Crypto Fear & Greed Index slipped from 33 to 31, reflecting weaker market sentiment than the previous day.
Open Interest Holds Above Historical Levels
Bitcoin derivatives activity also remained elevated.
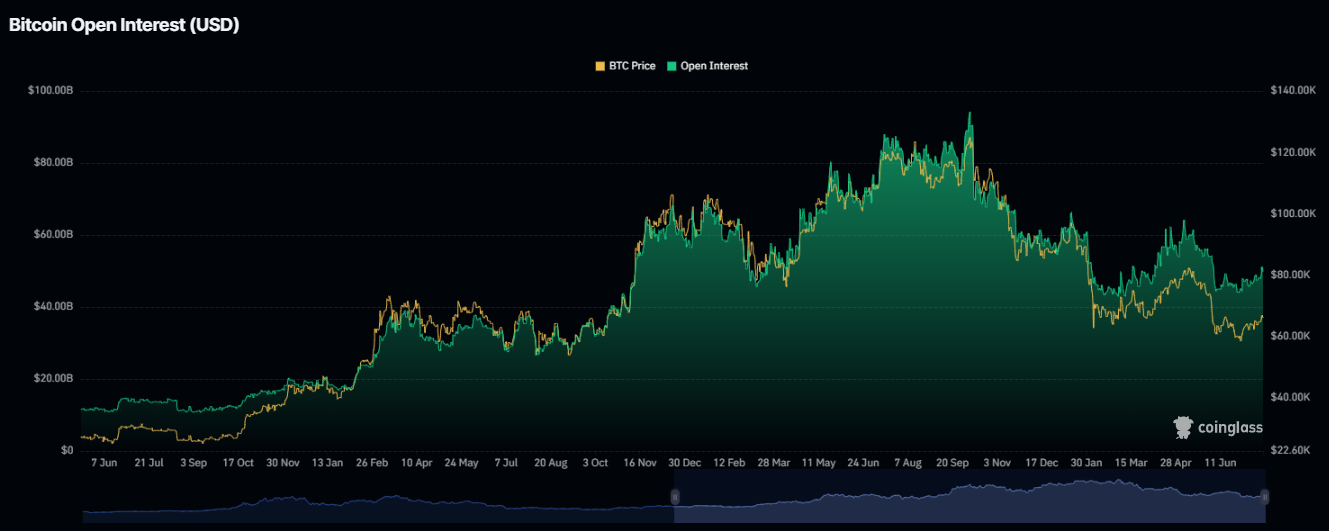
Open interest was at a level ranging between $50 billion and $60 billion after reaching $90 billion. Open interest had been seen moving in tandem with Bitcoin’s price through the data presented.
Source: Coinglass
Market Highlights
- Spot Bitcoin ETFs have registered almost $1 billion in flows in the past seven trading sessions.
- Bitcoin is still trading above the 100 EMA and 200 EMA, maintaining its technical structure.
- Open interest has maintained itself high above average levels despite falling from prior highs.
Bitcoin Price Prediction Outlook
The Bitcoin price forecast is still based on the ability of Bitcoin to regain resistance at the range of $66,560-$66,924, supported above $65,026 and several moving averages.
The current analysis on the chart indicates that the crypto asset maintains its overall trend despite neutral momentum. The Bollinger Bands suggest stable volatility, Fibonacci support is still intact, and open interest has stabilized from recent falls. In addition, the ETF flows have stayed positive for the last seven days.
FAQs
Why does Bitcoin trade below $66,000?
Bitcoin witnessed selling pressure amid several failed attempts to breach above $66,000, causing it to retreat into the mid-$65,000 region.
What are the major support areas for Bitcoin?
Support levels include $65,026, the $64,988 50 EMA level, and a horizontal level at $63,702.
Where lies the next resistance level for Bitcoin?
The resistance area lies between $66,560 and $66,924, with swing high resistance at $66,168.
What are the recent net inflows of spot Bitcoin ETFs?
The cumulative net inflow for spot Bitcoin ETFs stands at $999.38 million in seven successive trading sessions, amounting to $68.99 million on the most recent trading session.



