

- The price action of Ethereum remained above key EMA support, even after seeing a pullback, with $1,940 being the next level of resistance.
- Week-to-week inflows to U.S. spot Ethereum ETFs amounted to $105 million along with higher volumes and institutional participation.
- ETH is currently rebounding based on Fibonacci and moving averages with $1,805 as support and $2,042 as the next resistance.
Ethereum price forecast still relies on the ability of ETH to keep its recovery from the $1,880 area. Ethereum was trading at $1,855.94, having dropped 0.73% in the last 24 hours amid moderate short-term selling as ETH failed to hold its gain.
Despite the drop in the price, the activity in the market has been quite high, and the daily trading volume has increased by 66.54% to $8.94 billion. The market cap of Ethereum was $223.98 billion, which means that the overall valuation of the market was stable amid the decline.
Ethereum Price Forecast Reveals Short-Term Consolidation
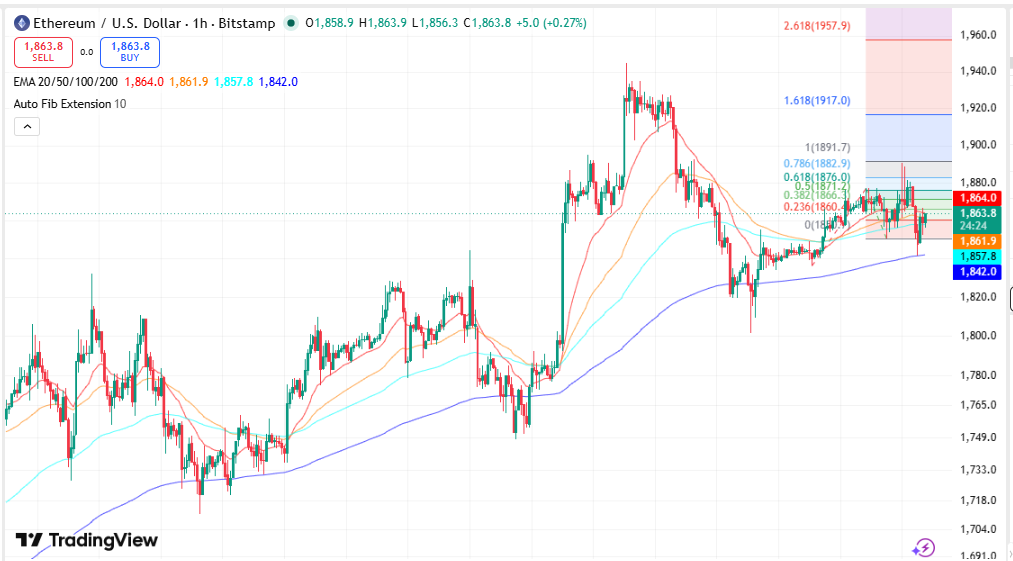
On the one-hour chart, Ethereum was trading around $1,858, being slightly below the 20-period EMA at $1,864 and the 50 EMA at $1,862.
Nevertheless, ETH was still trading above both the 100 EMA at $1,857.7 and the 200 EMA at $1,841.7, signaling that the overall intraday trend did not change to bearish. The price is now consolidating following the previous rally as the bulls were trying to defend support near $1,850.
Source: Trading View
Key observations on the hourly chart:
- Price is still trading above both the 100 EMA and 200 EMA despite the weakness in the past couple of days.
- Resistance formation continues at $1,880 – $1,900.
- Support can be found near $1,850.
Daily Chart Maintains Recovery Setup
The daily timeframe still reflects the recovery of Ethereum after the low price of $1,506.81 in June, as the Fibonacci retracement and extension levels show the upcoming technical targets.
Ethereum is now trading in between the 0.236 Fibonacci level of $1,711 and the 0.382 Fibonacci level of $1,837. The Supertrend indicator of $1,676.39 is also below the present price and still gives technical support.
Another important move is the meeting of the 20-day EMA of $1,804.92 and the 50-day EMA of $1,815.6These moving averages have formed a narrow support zone beneath the current market price. Holding above both averages on a daily closing basis keeps the present recovery structure unchanged.
The next major resistance sits near $1,940, where the 0.5 Fibonacci retracement at $1,939.99 aligns closely with the 100-day EMA at $1,935.99. That combination creates one of the strongest technical resistance zones currently visible on the chart.
Key Technical Levels
| Level | Price |
| Immediate Support | $1,804.92 |
| Supertrend Support | $1,676.39 |
| Major Resistance | $1,939.99 |
| Next Resistance | $2,042.22 |
| June Low | $1,506.81 |
Ethereum Price Prediction Identifies Resistance Targets
Beyond the current resistance zone, additional Fibonacci levels continue defining the broader technical outlook.
After breaking above the $1,939.99 resistance zone, the next level of resistance on the way higher comes in at $2,042.22, which is the 0.618 Fibonacci retracement level. Beyond that level lies the next resistance level at $2,187.76, which is the 0.786 Fibonacci level.
Other levels of resistance in this zone are:
- 200-day EMA at $2,199.46
- 1.618 Fibonacci extension at $2,908.57
Key resistance observations:
- Resistance is enhanced by the 100-day EMA around $1,940.
- Resistance is enhanced by the 200-day EMA around $2,200.
- Fibonacci levels continue defining the next upside price zones.
Weekly Trend Continues to Show Structural Support
The weekly chart places Ethereum near the lower boundary of a long-term ascending channel. The current trades are near the support trend line of the channel, while the top of the range looks to the $6,000 level in 2027.
The market analyst Kucuker said that 2026 may turn out to be the year when Ethereum makes an all-time high. As per the analysis, market cycles indicated that negative sentiment periods were observed near the longer-term low points and not when a trend reversal began.
ETF Inflows and Derivatives Participation
Institutional participation increased during the week of July 13-17 as the total U.S. spot Ethereum ETFs saw $105 million in net inflows.
BlackRock’s ETHA witnessed flows of $135 million, thus taking its overall flows to $113.1 billion. On the other hand, Fidelity’s FETH had outflows worth $21.56 million. The aggregate net asset value of all U.S. spot Ethereum ETFs was $9.97 billion, which constituted 4.48% of Ethereum’s total market cap.
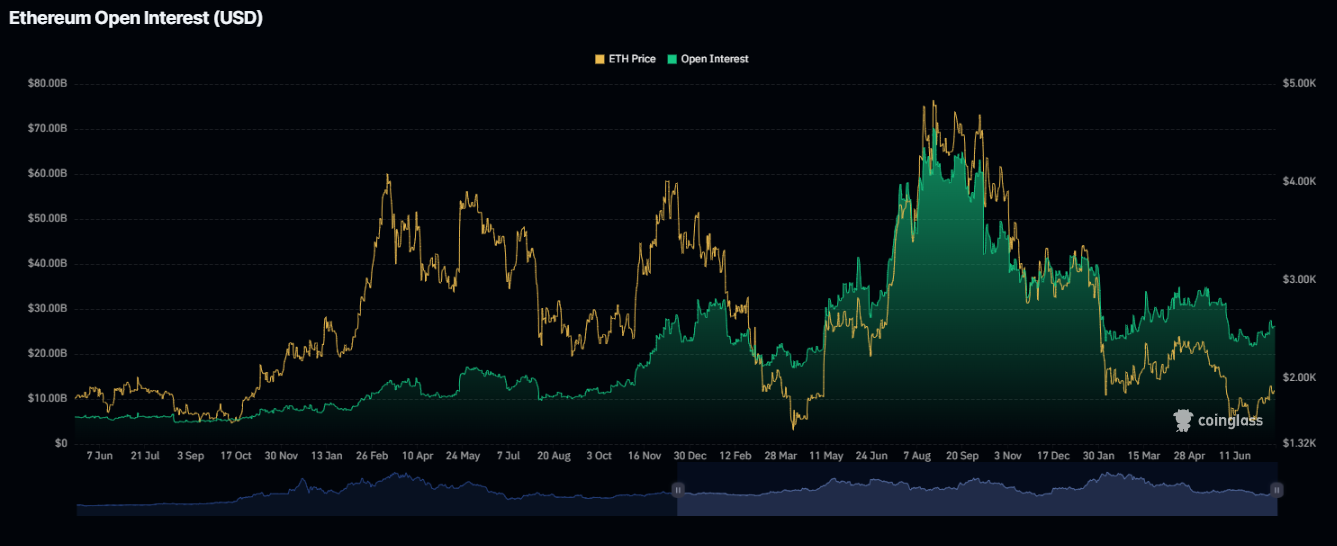
In terms of derivatives, there was an increased trading volume of 96.93%, resulting in the volume figure of $29.15 billion, while open interest fell by 1.27% to $26.01 billion. This is because trading volume had picked up pace, but not leverage position.
Source: Coinglass
The options’ volume shot up by 56.74% to $583.53 million, although options open interest stayed flat at $4.71 billion. In the last 24 hours, long liquidations stood at $24.02 million, whereas short liquidations were at $14.77 million.
As per the Binance stats, leading traders had a 1.98 long-to-short account ratio and 1.42 long-to-short position ratio, implying a net long bias before the start of the new trading week.
FAQS
What is the nearest support of Ethereum?
Nearest support is the 20-day EMA at $1,804.92, then Supertrend support at $1,676.39.
What is the next important resistance of Ethereum?
Next important resistance is $1,939.99, where 0.5 Fibonacci Retracement meets 100-day EMA.
What does the ETF flow suggest?
ETF flows in U.S. spot Ethereum amounted to $105 million on a net weekly basis, taking the total assets to $9.97 billion.



