

- Ethereum managed to stay above $1800, while the resistance around $1823 kept on holding back more price gains for the traders.
- The longs were leading, since funding was neutral, and the open interest was stable at the $25 billion mark.
- ETH will have to stay above the support levels, while breaking the resistance levels could improve the recovery trend.
ETH/USD Price Analysis Under the Spotlight as the Cryptocurrency Resides Above $1,800 Amid Yet Another Volatile Trading Session. After the cryptocurrency managed to rise above the level of $1,820 but retreated again, buyers emerged at the lower end of the trading range to secure the price position above the vital technical support.
Meanwhile, the derivatives market positioning still demonstrated preference for long positions, while funding rates stood around neutral.
Ethereum Price Prediction Dependent on Resistance Above $1,800
Ethereum was priced at about $1,804.78, indicating a marginal 0.25% increase in its value for the day after bouncing back from a substantial intra-day drop. In the trading period, ETH went above the $1,820 mark before bears pressured the price into a drop below $1,780.
The buyers subsequently came back into play, enabling the coin to bounce above the crucial $1,800 mark. The trading volume fell by 4.77% to $7.41 billion for the day while Ethereum’s market cap held steady at $217.8 billion.
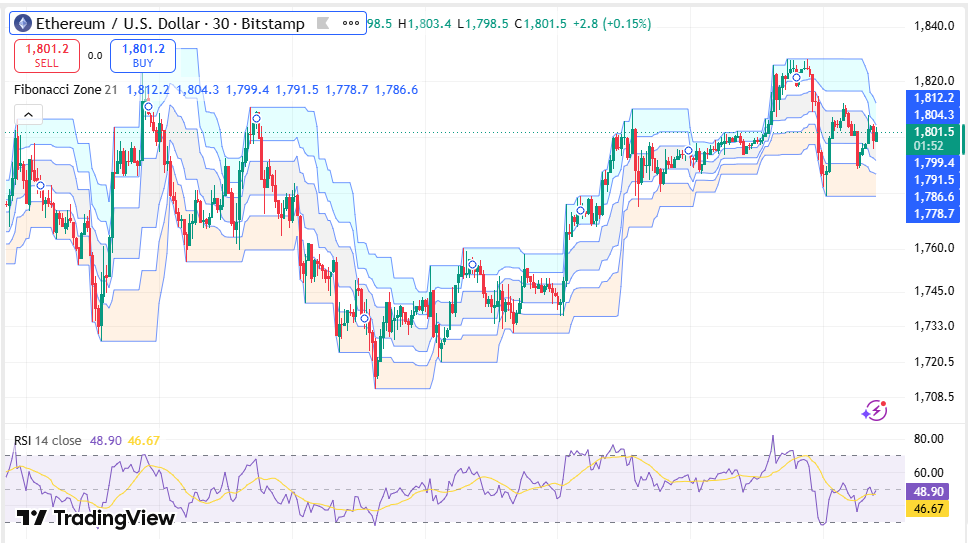
From the Bitstamp 30-minute chart, Ethereum was seen trading at $1,803.6 while holding above the 100-period Exponential Moving Average at $1,795.4 and the 200-period EMA at $1,782.6.
On the other hand, the 20-period EMA of $1,802.0 and the 50-period EMA of $1,802.6 were getting ready to converge with the present trading range, implying a consolidation phase rather than acceleration phase.
Technical Levels Define Ethereum’s Next Direction
The Fibonacci Zone scanner showed that there is immediate resistance in the area of $1,806.0-$1,822.9, thus putting Ethereum right under a significant technical resistance level.
Source: Trading View
The support levels were set at:
- $1,795.5
- $1,789.1
- $1,778.7
The Relative Strength Index was calculated at 50.57, with the signal line standing at 46.61. This shows a neutral momentum with a slightly bullish bias due to the current trading range.
An upside breakout beyond the resistance region may set the stage for Ethereum to reach higher prices. On the other hand, a fall below $1,795 will place the next supports on the radar according to the Fibonacci tool.
On another note, Ethereum was also trading above its 50-day SMA at around $1,760, a mark recovered during this month after the cryptocurrency had been trading below it following the May correction.
Derivatives Data Reveals Neutral Positioning Amidst Volatility
The derivatives market continued to show the bias for long positions.
The Long/Short Ratio on Binance for ETH/USDT was 1.7086 and that of OKX was 1.28. This means that more traders held long positions than short positions.
On Binance, the Top Trader Long/Short Ratios included:
| Metric | Value |
| Binance Long/Short Ratio | 1.7086 |
| OKX Long/Short Ratio | 1.28 |
| Binance Top Traders (Accounts) | 1.6267 |
| Binance Top Traders (Positions) | 1.4075 |
However, despite the prevalence of longs, the statistics concerning liquidations confirmed the ongoing volatility in the market.
In the last hour alone, there were $1.97 million liquidated positions, out of which around $1.96 million originated from short positions.
Overall, within the last 24 hours, the amount of liquidations was equal to $51.76 million, which included:
- $21.03 million liquidated longs
- $30.73 million liquidated shorts
Such data indicated that leveraged positions on either side suffered losses amid Ether’s relatively high daily volatility.
Funding Rates and Open Interest Show Prudent Trading
Price Forecast Ethereum also relies on derivatives involvement, which saw funding rates and open interest remaining relatively steady.
The OI-weighed funding rate held neutral during the recent sessions, fluctuating for a while into positive and negative zones before settling a little bit above zero. This means that the longs were making a small payment premium for holding their positions without going into over-leverage.
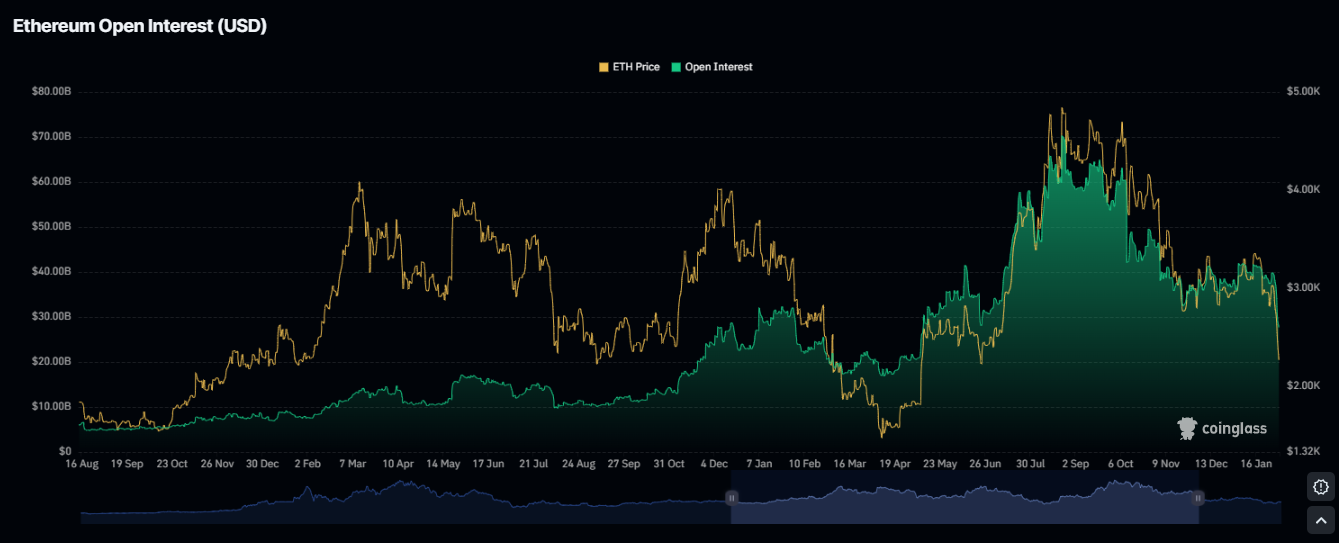
In contrast, however, the open interest in Ethereum stabilized at around $25 billion after falling sharply from the peaks above $60 billion.
This indicated that leveraged positions had fallen off significantly from more volatile periods in the past. The stabilization could mean that more positions are starting to enter the market now without any speculative moves coming right away.
Source: Coinglass
Liquidations on the perpetual contracts also demonstrated more calmer markets compared to the past few days. Trading for the recent few days showed more evenly balanced liquidations of long and shorts with no liquidation clusters like in past drops.
Market Fails to Hold Resistance Levels as Analysts Eye Crucial Support
After Eric Trump tweeted that Ethereum was “pumping hard” and that “crypto is the future,” the cryptocurrency saw some interest.
Nonetheless, trading activity in the market followed technical levels without expanding further up. ETH hit the $1,805-$1,812 resistance zone before the sellers stepped in to soak up demand.The price subsequently declined to an intraday low near $1,780 before stabilizing around $1,792.
Separately, Filip Vantchev, owner of Coindoo, identified another technical area receiving attention below current prices. According to his assessment, the area around $1,730 combines the 50-day SMA with the 0.236 Fibonacci retracement of June’s decline.
The analyst argued that holding the close above this level each day would ensure the maintenance of the existing market structure which started when the ETH price recovered from about $1,505.
FAQs
What is the current outlook on Ethereum prices?
After making a recovery from its intraday pullback, Ethereum is now trading close to the $1,800 mark. From a technical perspective, there are no signs of the asset crossing below its important moving averages, with resistance being provided by the range $1,806 – $1,823.
What are the important support and resistance levels for Ethereum?
Current levels of resistance are $1,806.0 and $1,822.9. Key levels of support are situated at $1,795.5, $1,789.1, and $1,778.7, while there is technical support at $1,730.
What is the Ethereum’s RSI reading?
Ethereum’s 30-minute RSI currently trades at 50.57, with its signal line at 46.61, which means that there is neutral momentum with a slight bullish bias. The daily RSI currently stays unchanged at 57.