
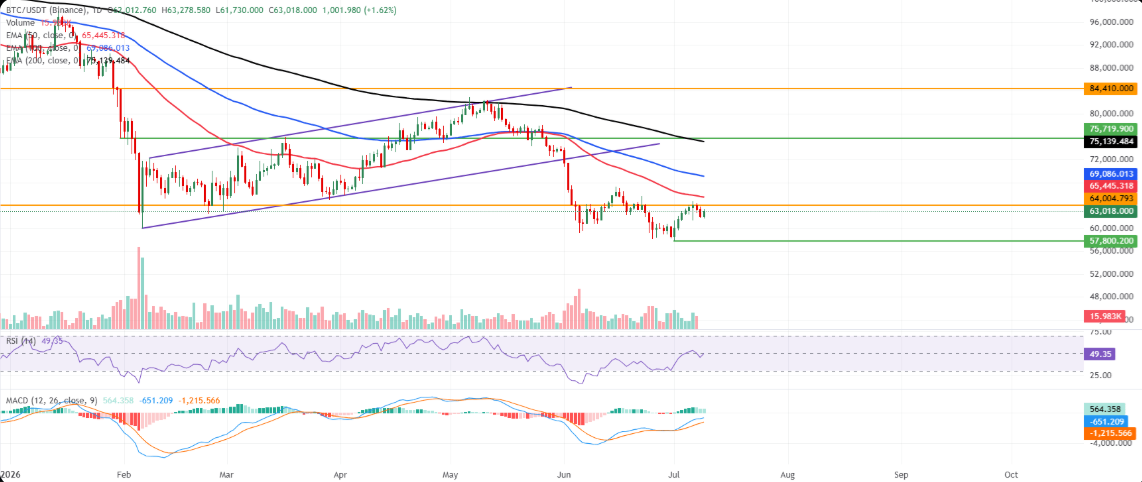
- The price of BTC traded above the $63K mark but beneath a crucial resistance zone.
- Spot Bitcoin ETF outflows were forecast to amount to $84.86M.
- RSI was approaching the neutral territory whereas MACD remained positive with key support at $60K.
Bitcoin Price was back in focus following Bitcoin’s failure to sustain its gains despite moving above the $63,000 mark. The cryptocurrency continued moving below various technical resistance levels amid ongoing developments between the U.S. and Iran, and shifting expectations around the U.S. central bank’s policies.
In addition, on-chain metrics highlighted Bitcoin’s neutral valuation levels as well as identified critical resistance and support levels that may play an important role if market circumstances were to change.
Bitcoin Price Prediction Tied to GeopoliticsDevelopments
Bitcoin continued trading above the $63,000 mark on Thursday after rallying slightly from a rejection near the $64,000 resistance level.
Source: Trading View
The recovery came as broader financial markets continued monitoring military developments between the United States and Iran.
The latest escalation followed new U.S. military strikes targeting Iran after attacks on commercial vessels in the Strait of Hormuz. Attacks on U.S. military facilities by Iran were seen in Bahrain and Kuwait.
The interest from the market rose even more when President Donald Trump declared that the MOU and the ceasefire agreement with Iran had ended.
At the same time, investors assessed the minutes from the Federal Open Market Committee meeting held on June 16 and 17.
The minutes showed policymakers remained divided over the future direction of interest rates, with inflation continuing to receive close attention even as concerns surrounding labor market conditions eased.
Following the release, pricing in interest rate derivatives shifted. According to the CME FedWatch Tool, the probability of a Federal Reserve rate increase at the July meeting climbed above 27%, compared with less than 20% recorded the previous Thursday.
The convergence of geopolitical uncertainties and the changing expectations for monetary policies happened amid lower demand for risky assets like cryptocurrencies.
ETF Flows Suggest a Cautious Approach by Institutions
Institutions displayed diverging sentiments all throughout the week. Bitcoin spot ETFs saw a temporary resurgence in demand during the first part of the week after weeks of being in net withdrawals.
Nevertheless, according to the numbers posted by SoSoValue, spot bitcoin ETFs suffered net outflows worth $84.86 million on Wednesday.
Alternating flows pointed to the fact that institutions continuously adjusted their exposures amid the persisting global geopolitical and macroeconomic risks.
A continuation of the outflows trend can add more downward pressure on the BTC prices, in case institutions continue reducing their interest in the cryptoasset, even though the weekly flows were alternating rather than trending in one direction.
Positive Factors Supporting the Current Price Dynamics
- BTC has retraced to above $63,000 amid rejection at the $64,000 resistance area.
- MACD continued to remain above zero, pointing to the slowdown of the downtrend momentum.
- The RSI was still trading close to the neutral 50 mark, suggesting easing of selling pressures.
Bitcoin Price Prediction Centered Around On-Chain Support Levels
The on-chain indicators kept indicating key valuation levels for Bitcoin.
According to crypto analyst Ali Martinez, Bitcoin was trading within the -0.5 and -1.0 MVRV Pricing Bands, which according to him provided no clear valuation edge.
Based on his analysis, the -1.0 MVRV Pricing Band was trading at $49,867, making it a possible accumulation level for Bitcoin in case of any further fall. Martinez also highlighted $63,000 as one of Bitcoin’s largest resistance areas.
Based on the on-chain transaction information, about 623,000 BTC transactions have been made at that price point. Any investor who invested when the price was at $63,000 could choose to unwind positions once the prices revert back to the purchase prices.
If Bitcoin fails to establish support above $63,000 and later falls below $59,000, Martinez identifies additional transaction clusters that could provide support. On-chain data places approximately 115,000 BTC around $46,000 and another 206,000 BTC near $37,870.
Key On-Chain Levels to Watch
- The $63,000 area remains the largest resistance cluster based on transaction history.
- Potential Accumulation Zone exists at the -1.0 MVRV Pricing Band, which is $49,867.
- The on-chain support zones are at $46,000 and $37,870 in case of higher selling pressure.
| Key Bitcoin Levels | Price | Description |
| Immediate Resistance | $64,004 | Horizontal resistance |
| 50-day EMA | $65,445 | First resistance level for trend |
| 100-day EMA | $69,086 | Intermediate resistance |
| 200-day EMA | $75,139 | Resistance for long-term trend |
| Major Resistance | $84,410 | Structural resistance |
| Psychological Support | $60,000 | Important lower level |
| Yearly Low | $57,800 | Next downside reference |
| MVRV Buy Zone | $49,867 | -1.0 MVRV Pricing Band |
Technical Indicators Show Stabilizing Momentum
On Thursday, bitcoin was trading at around $63,018 following a small recovery from an earlier weak performance.
Nevertheless, the coin traded below the exponential moving averages of 50, 100, and 200 days, suggesting that there was no change in the general technical analysis. Currently, the 50-day EMA is at $65,445 while the 100-day EMA and 200-day EMA are at $69,086 and $75,139, respectively.
The Relative Strength Index (RSI) was holding at around 49 on the daily chart and still below the neutral line at 50.
Meanwhile, the Moving Average Convergence Divergence (MACD) oscillator stayed in the positive region, which meant that the bearish momentum had become less strong. Nevertheless, Bitcoin was trading below its trend indicators.
A move above the immediate barrier near $64,004 would expose the 50-day EMA, followed by resistance at the 100-day EMA and the longer-term 200-day EMA. Beyond those levels, the next major technical barrier remains near $84,410.
On the downside, the current technical structure identifies the $60,000 area as the nearest psychological support. If renewed selling pressure pushes Bitcoin below that threshold, attention could shift toward the yearly low of $57,800 before market participants monitor the larger on-chain support zones identified at $46,000 and $37,870.
Technical Levels in Focus
- Immediate resistance is located at $64,004 before the 50-day EMA at $65,445.
- The RSI near 49 and a positive MACD point to stabilizing momentum rather than a confirmed reversal.
- A move below $60,000 could shift focus toward $57,800 and lower on-chain support zones.
FAQs
Why is Bitcoin Price Prediction gaining popularity this week?
Bitcoin Price Prediction is gaining popularity because the digital currency is still trading below key resistance levels and amid watching geopolitics in between the U.S. and Iran, Fed expectations, ETF movements, and technical signals.
What does the latest Bitcoin ETF movement look like?
As per the SoSoValue report, the total outflows of $84.86 million in Bitcoin spot ETFs were recorded on Wednesday despite some inflows on the previous days.
Why Is The Price Level Of $63,000 Important?
In accordance with the on-chain data, 623,000 BTC have been sold at the price level of $63,000 in the past.