

- Stellar XLM is trading above important moving averages, and $0.1964 continues to act as a resistance level.
- The XLM price has increased to $0.1922 after a recovery from $0.175 and is currently trading above the support level of $0.1884.
- RSI is standing at 58.09, reflecting a bullish momentum as XLM continues to trade below $0.1938 upper Boll
The price of Stellar XLM is trading at $0.1922, with an increase of 1.16% over the last seven days, after recovering from a downturn towards $0.175 on September 12. This bounce back was enough to lift XLM back over $0.195 before settling to the current price. According to daily data from Bitfinex, the price of the cryptocurrency is now at $0.1915.
Moreover, it’s picking up after a daily low of $0.1452. XLM has been near the high end of its trading range over the past few days but is starting to form a resistance area near $0.1938 – $0.1964 on the chart. Technical indicators are currently positive, and the price is above a number of moving averages that are providing support for the current structure.
Stellar XLM Price and Moving Average Trends
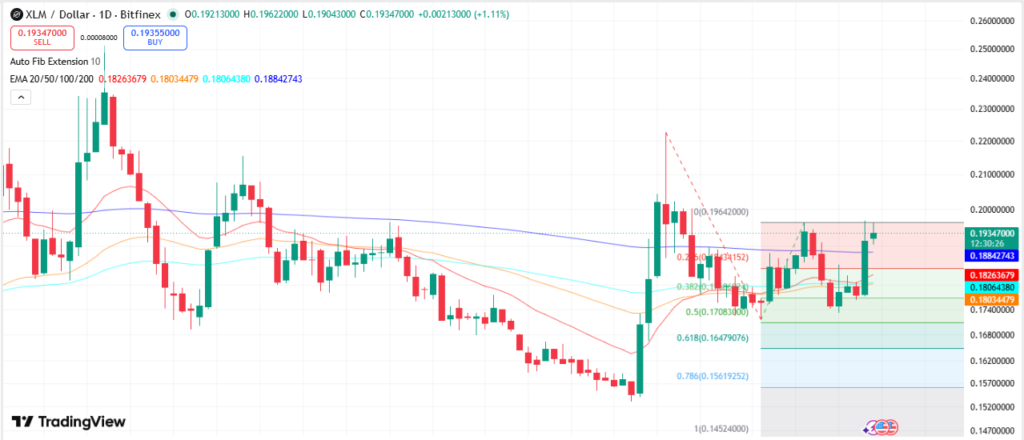
The XLM/USD D1 time frame chart on Trading View depicts the instrument at around $0.1915, the high of the 200-day exponential moving average at $0.1884. The 200 EMA currently represents an immediate dynamic support level.
Price is also above the 20 EMA at $0.1824 and the 50 EMA at $0.1802, keeping the asset above each of the listed exponential averages.
 Source: Trading View
The moving average system in the chart is complemented by the 20-period simple moving average at $0.1821. The position of this moving average lies below the price and coincides with the midpoint of the Bollinger Bands.
The positioning of the XLM above the moving averages comes after the recovery of the coin from $0.1452. According to the information in the table, the $0.1884-$0.1900 region is a significant one since the 200 EMA is within it. Holding above this area would leave the recent recovery structure intact, while movement below $0.1800 would place the price closer to lower technical levels.
Key Support and Resistance Boundaries
The XLM/USD daily chart places immediate resistance around $0.1964, which represents the recent local high. Before reaching that level, the price is approaching the upper Bollinger Band at $0.1938. A move above $0.1938 would place $0.2000 as the next level identified by the chart data.
The Fibonacci structure also identifies $0.1843 as the 0.236 retracement level. This level sits below the current market price and above the moving-average cluster around $0.1800 to $0.1824.
On the downside, there is an identified breakdown level at $0.1800 that will change the existing momentum setup. A move below that area would bring the $0.1708 Fibonacci retracement level into focus. Another chart view places key support at $0.1716, while major overhead resistance is identified at $0.2227.
These ranges specify a wide technical range that lies between about $0.1716 and $0.2227, with the most immediate trading range lying between the $0.1800 support level and resistance at around $0.1964.
XLM Stellar Price Momentum & RSI
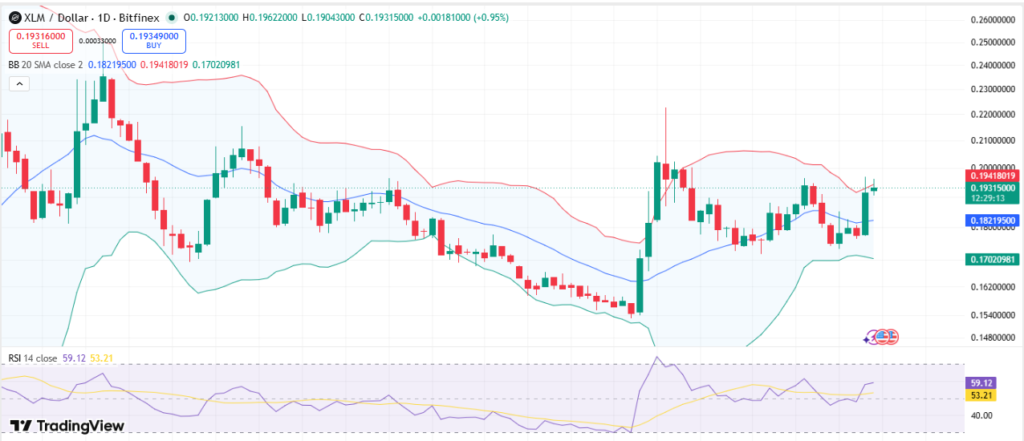
The Bollinger Bands data indicates that the price of XLM is trading at $0.1915, which is close to the upper band of the Bollinger Bands at $0.1938. The middle band is at $0.1821, and the lower band is at $0.1704 presently.
 Source: Trading View
The RSI 14 is at 58.09, higher than the signal line at 53.14. This means there is buying pressure within the cryptocurrency but not yet in the overbought territory as indicated in the chart data.
The current indicator setup leaves $0.1938 as the immediate Bollinger Band resistance. A rejection at that level could result in consolidation toward the $0.1821 20-period SMA, while a sustained move beyond the upper band would place $0.2000 among the chart’s identified levels.
Stellar Institutional Tokenization Activity
Market data provided in an X post by BSC News highlights year-to-date growth in tokenized fund market capitalization across major blockchain networks. Stellar was reportedly able to record about $2.5 billion in additional issuance, thus putting it among the top networks like BNB Chain in the cited statistics.
https://twitter.com/BSCNews/status/2099779583407268023
Solana recorded third place with an estimated $1.2 billion in growth, followed by zkSync Era with $798.6 million and Avalanche with $456.1 million. The figures presented in the post show increased tokenized fund activity across the listed networks.
Another X post by Crypto Analyst ALLINCRYPTO cited a UK Finance report identifying tokenized money-market funds as a sector reaching institutional scale.
The post listed Franklin Templeton, Ondo, WisdomTree, and BlackRock among asset management firms involved in the expansion and stated that several of these institutions already use Stellar or deploy tokenized funds on the network.



