

- The market capitalization of Monero is now more than that of Chainlink since the price of XMR is now approximately $537 and is in good gains for the week.
- XMR is above its primary moving averages, however, RSI shows overbought for XMR.
- Monero may not be ahead of Chainlink in market capitalization, LINK is ready to alter the scenario soon.
XMR made its way to the top 10 crypto list based on market capitalization after surpassing Chainlink in valuation. XMR is trading at $536.78 with a weekly gain of 2.63%.
The market capitalization of XMR is roughly $10.09 billion. The market capitalization for Chainlink is estimated at $9.96 billion, creating a gap of about $110 million. XMR has managed to achieve this after recording more impressive gains in the past month than LINK.
Monero Market Cap Surpasses Chainlink Market Cap
Monero market cap is estimated to be between $10.07 and $10.09 billion and is above Chainlink at the moment. This gap makes up only more than 1% of their valuations according to the numbers that are stated above.
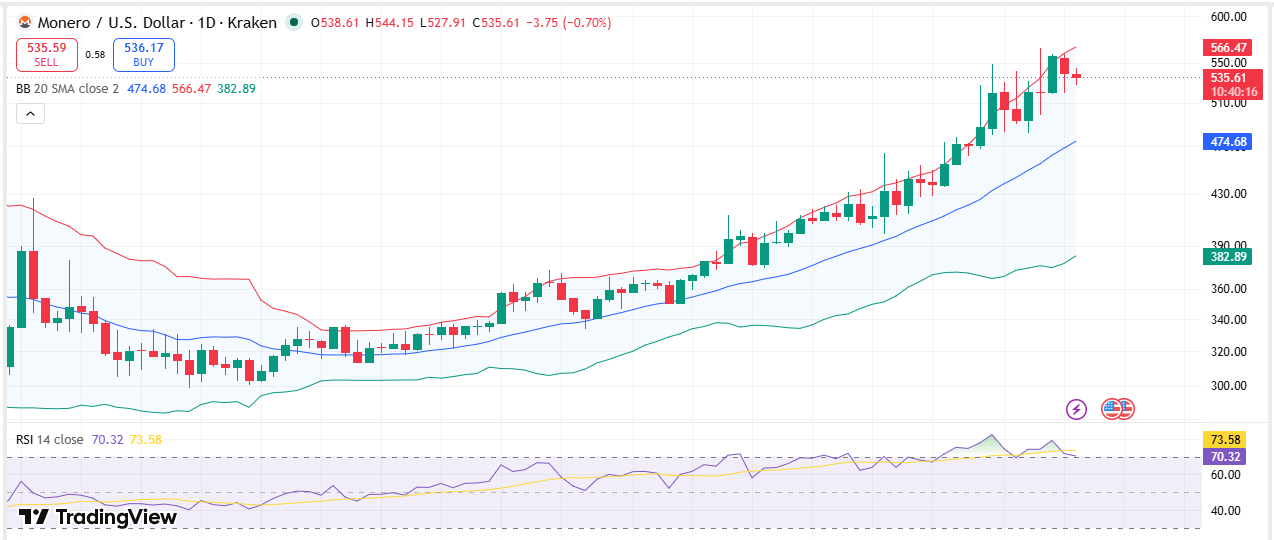
Monero market cap was driven by its price growth from roughly $350 in early August to about $570 in recent times. Since then, XMR has entered the consolidation period with the price hovering around $535-$537.
LINK price has grown significantly lately as well. Chainlink price rose by almost 18% in seven days and approximately 8.7% in 24 hours according to coinmarketcap. Its price has bounced back from $8-$9 levels in August and has broken the resistance level at $13 on the daily chart.
The market capitalization ranking remains close because LINK’s recent performance has been stronger over the shorter period, while XMR recorded a larger increase over the preceding month.
XMR Consolidates Below Key Resistance
XMR is trading within a range that has established approximately $490 as a lower level and $560 as an upper resistance area. The daily chart shows price consolidating near $537.11 after its recent advance.
The Bollinger Bands show an upper band at $566.75, a 20-period simple moving average at $474.76, and a lower band at $382.76. Price remains close to the upper band while the channel is expanding.
Source: Trading View
The 14-day RSI is 70.91, compared with an RSI SMA of 73.63. The reading places XMR in overbought territory while the price remains above its key moving averages.
The Fibonacci levels provide additional reference points.The 2.618 extension is at the level of $490.50, whereas the 3.618 level is found at $550.29. The 4.236 extension is at the price of $587.34. The 4.236 extension stands at $587.34.
Moving Averages Confirm Upward Structure
XMR remains above its major exponential moving averages. The 20 EMA is currently trading at $483.70, the 50 EMA at $431.29, the 100 EMA at $398.83, and finally,
The supplied chart data shows the price trading above each of these averages. The 20-day moving average is also around $470, reinforcing the distance between the current price and the shorter-term trend reference.
The technical structure therefore remains aligned with the recent upward move, although the RSI reading above 70 indicates that price has entered a level associated with increased short-term correction risk.
Chainlink Remains Close Behind
Chainlink’s latest breakout has moved LINK toward the $13.50 area, while its 20-day moving average remains around $11.15. Its RSI has moved above 75, placing the asset further into overbought territory than XMR according to the supplied data.
The $13.50–$14 range represents the next stated resistance area for LINK. Its gains in recent times have made the market cap differential between the two cryptos less important.
FAQs
What is the present market cap of Monero?
The market capitalization of Monero stands at approximately $10.09 billion according to the provided market data.
What is the present price of Monero?
Currently, Monero trades at about $536.78, registering a weekly performance of 2.63%.
What is the resistance level for Monero?
The $566.75 is identified as the resistance on the daily charts via the upper Bollinger Band, while $550.29 is the 3.618 Fibonacci extension point.



