

- Ethereum price stays at $2,450 even when the trading volume decreases and RSI starts to cool off due to a rally.
- Bitmine purchased 53,501 ETH last week and owns more than 5.9 million ETH in 65 weeks of purchasing.
- Ethereum trades above important moving averages and the current resistance for Ethereum is $2,550.
Ethereum is trading at $2,453.97, down 0.86% over the week, as the cryptocurrency consolidates after a period of strong upward movement. ETH recently approached $2,550 before pulling back toward the $2,440-$2,454 area.
Meanwhile, Bitmine Immersion Technologies continued its Ether accumulation for a 65th consecutive week, bringing its holdings above 5.9 million ETH.
Ethereum Prices Maintain Support on Important Technical Levels
In relation to the most recent movement in Ethereum price, there was a period of consolidation near recent highs after experiencing a rally. The Ethereum prices were seen at $2,441.40 and $2,441.59 based on the Coinbase chart, showing a decline of 1.05% and 1.04% respectively. There was another instance where the price was at $2,433.46, a decline of 1.37%.
According to the technical analysis, the $2,550 zone stands out as the immediate resistance level. The historical support levels are $1,942.00 and $1,820.14. The 20-day moving averages stand as a near-support level.
Ethereum is currently trading above its 20-day EMA ($2,310.14), 50-day EMA ($2,115.30, the 100-day EMA at $2,045.42, and the 200-day EMA at $2,164.14. The price is also above the 20-day simple moving average of $2,274.87.
Ethereum Technical Indicators Show Cooling Momentum
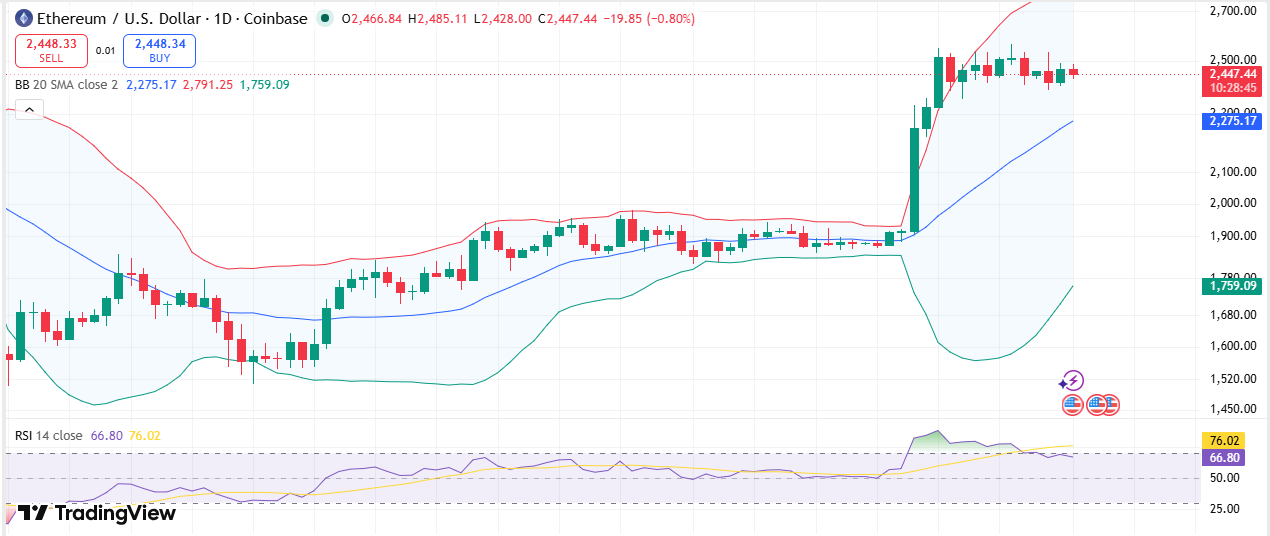
The Bollinger Bands on the daily Ethereum chart have widened sharply following a breakout from a period of tighter price movement. ETH moved toward the upper band at $2,790.55 and remains above the middle band represented by the 20-day SMA at $2,274.87. The lower band is positioned at $1,759.18.
Source: Trading View
The 14-period RSI stands at 66.18 after reaching 75.98. The decline in the indicator followed the recent price rally and placed the RSI below its earlier overbought reading.
Fibonacci extension levels also show how far ETH has moved above previous technical benchmarks. The 1.618 extension is positioned at $2,048.62, while the 2.618 extension stands at $2,170.48. Ethereum moved beyond the 4.236 extension at $2,367.65 and is currently consolidating above that level.
The $2,367.65 Fibonacci level and the $2,310.14 20-day EMA are identified as immediate support areas.
Bitmine Keeps Ethereum Buy Streak Alive
Ethereum is trading sideways close to previous highs as Bitmine Immersion Technologies maintains its streak of buying Ether. The firm bought 53,501 ETH last week, marking 65 straight weeks of buying.
As a result of the recent buy, Bitmine now owns over 5.9 million ETH. The holdings were valued at roughly $14.8 billion based on an Ether price of $2,511 as of Sunday.
Bitmine now owns 4.9% of Ethereum’s 120.7 million circulating supply, according to the supplied information. The figure places the company close to its stated goal of owning 5% of Ethereum’s supply.
The company’s continued accumulation has also left it with roughly $5.1 billion in unrealized losses on its Ether holdings, according to the supplied DropsTab data. The paper losses reflect purchases made during a period when Ether and the broader crypto market declined.
Tom Lee Highlights ETH Performance
Bitmine Chairman Tom Lee said Ether, Bitcoin and Solana were the three best-performing major assets since June 30, with ETH leading the gains.
Lee said the performance had created conditions for institutions to add to their crypto holdings, citing the relative performance of crypto assets against other macro assets during the third quarter.
The latest Ether purchase came as Bitmine’s digital asset portfolio increased in value alongside the broader crypto market recovery, despite the company’s sizable unrealized losses on its ETH position.
BMNR Shares Rise in August
Bitmine’s NYSE-traded BMNR shares were up 1.3% on Monday morning at $24.09 per share, according to the supplied Yahoo Finance data.
The shares were on track to finish the month with an almost 40% increase. The stock movement followed the company’s continued accumulation of Ether and the increase in the value of its digital asset holdings.
For Ethereum, the latest market data shows a combination of price consolidation, reduced trading volume and cooling momentum indicators. The cryptocurrency remains above its listed moving averages and the 4.236 Fibonacci extension while resistance remains around $2,550.
FAQs
What is Ethereum trading at?
Ethereum is trading at $2,453.97, down 0.86% over the week based on the supplied data.
What is Ethereum’s key resistance level?
The immediate resistance level identified in the technical analysis is $2,550.
Where are Ethereum’s main support levels?
Near-term support is identified at the $2,367.65 Fibonacci extension and the $2,310.14 20-day EMA. Historical support levels are $1,942.00 and $1,820.14.



