

- Dogecoin price was down 6.92% on a weekly basis, while Dogecoin’s market capitalization decreased by 11.46% to reach $12.57 billion.
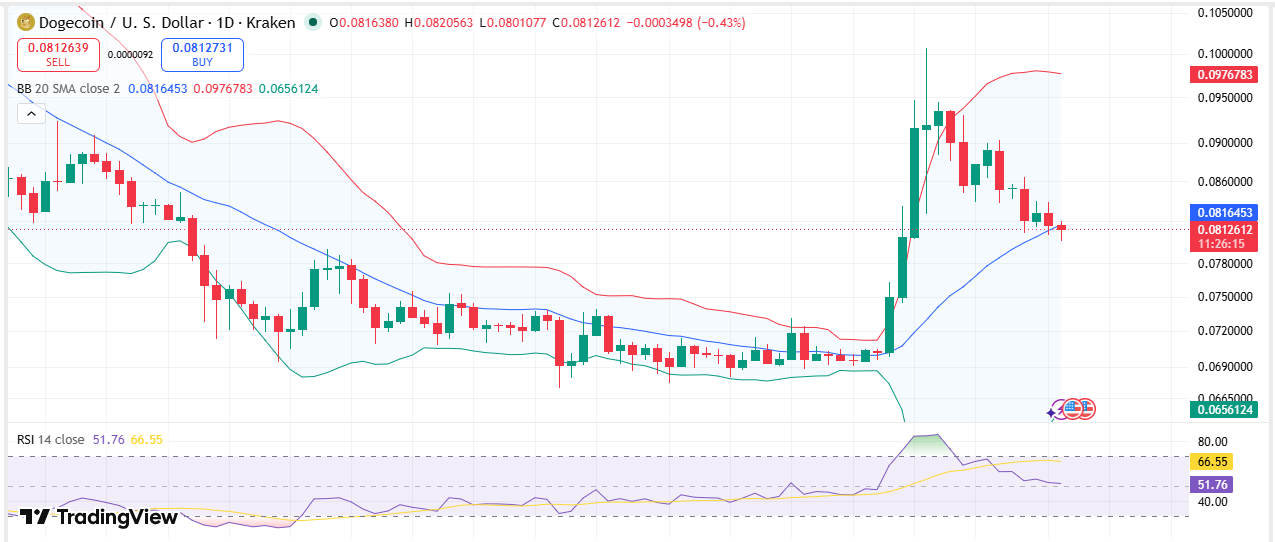
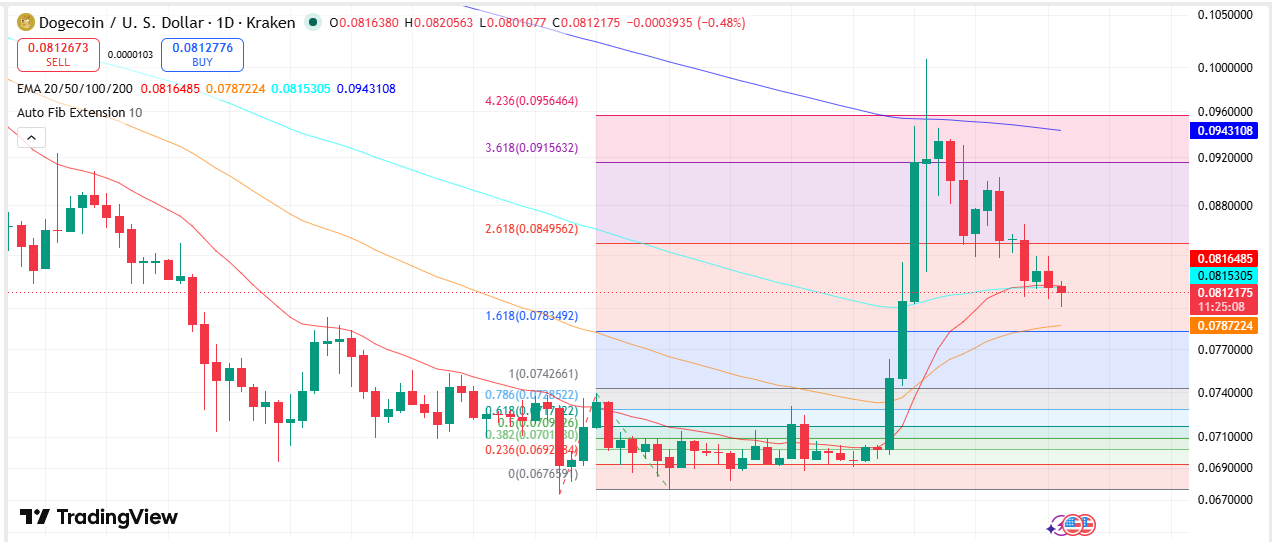
- DOGE is trading close to the 20-day SMA line while the 50-day EMA line is a crucial support level.
- The RSI indicator fell from above 80 to 50.8
Dogecoin price has fallen toward the $0.0807-$0.0811 range after a sharp retreat from recent highs near $0.098 to $0.10075. DOGE is down 6.92% over the past week, while its market capitalization has declined 11.46% to $12.57 billion.
The decline followed an early move toward $0.090 and intensified from August 31 as selling pressure pushed the token lower.
The latest pullback has brought DOGE close to several moving-average levels that now determine whether the current correction extends toward lower support or stabilizes around the present range.
Dogecoin Price Under Pressure at 20-Day SMA
The chart of the DOGE/USD pair on the daily timeframe demonstrates the current Dogecoin price at the level of $0.08076, down by 1.04% over the trading day, and testing the 20-day Simple Moving Average at $0.08162.
The decline came after DOGE experienced a major volatility expansion that widened the Bollinger Bands and lifted the price toward $0.098. Profit-taking then triggered a corrective move lower. With price now around the 20-day SMA, the next movement is centered on whether DOGE can remain above this level.
Source: Trading View
A break below the 20-day SMA would place attention on lower demand areas. The lower Bollinger Band is placed at $0.06558, which is another technical point that is lower than the trading range currently prevailing.
Momentum Drops As RSI Turns Neutral
The momentum indicators have also weakened due to the pullback. The RSI for the 14 periods has fallen from over 80, where it had become overbought, to 50.82. The RSI signal line is also placed at a higher value of 66.48.
The fall in the RSI places it back to its neutral point after the rally.
Source: Trading View
Moreover, the technical configuration indicates the importance of sustaining the 20-day SMA in relation to the existing price pattern. An extended trade above the moving average will help maintain the recent gains within the current consolidation pattern, whereas a breach below will put the lower supports into focus.
50-Day EMA Takes the Reins As the Key Support
Another significant technical level is found between the 20-day and 100-day exponential moving averages. DOGE is currently being traded around $0.08107, while the 20-day EMA is currently situated at $0.08163 and the 100-day EMA comes in at $0.08153. The two technical levels are placed above the current price and act as the dynamic resistances.
Further below, the 50-day EMA is situated at $0.07872, while the level comes very close to the 1.618 Fibonacci extension at $0.07835.
Maintaining the 50-day EMA would ensure that DOGE stays above this short-term support area. Moving out of this area would likely put emphasis on the $0.08496 price target, which is equivalent to the 2.618 Fibonacci extension level.
DOGE Meets Resistance Near the 200-Day EMA
The recent fall occurred after a strong rise that saw DOGE move closer to higher Fibonacci extension levels until encountering resistance near the 200-day EMA line at $0.09431.
The rejection at this level was followed by the corrective sell-off to the confluence of the moving averages near $0.081.
The technical pattern currently has a number of defined levels. These include the immediate resistance level of $0.08153-$0.08163 and the nearby support levels of $0.07872 and $0.07835. The $0.07427 level represents the breakout base and corresponds with the 1.0 Fibonacci level.
Lower Support Levels Remain in Focus
The latest chart data also places a major horizontal support level at $0.06732. This sits above the lower Bollinger Band at $0.06558 and below the $0.07427 breakout base.
The sequence gives the current Dogecoin price several downside reference points if selling pressure continues. The first major level is the 50-day EMA around $0.07872, followed by the $0.07427 Fibonacci level. Further declines would bring $0.06732 and $0.06558 into focus.
On the upside, DOGE would need to move back above the 20-day and 100-day EMAs near $0.0815-$0.0816 before the $0.08496 Fibonacci level becomes the next identified technical level.
FAQs
What is the current Dogecoin price?
DOGE is currently trading between $0.0807-$0.0811 based on the market data available.
What percentage has DOGE gone down in the last week?
DOGE has seen a drop in price of 6.92% and in market cap of 11.46% in the last week, making its market cap go down to $12.57 billion.
What is the major support level for Dogecoin?
The nearest support levels are 50 days EMA of $0.07872 and 1.618 Fibonacci of $0.07835.



