

- Bitcoin Price Prediction analyzes the strategy’s 3588 BTC sell as traders observe resistance zones carefully.
- Bitcoin was trading above its 20-day EMA although the important moving averages restrict any upward movement on the chart.
- The open interest fell, but the stable exchange activity indicates that the market is consolidating.
Bitcoin Price continues to be a key area of attention following the revelation by Strategy that it had disposed of 3,588 units of Bitcoin, marking its second such transaction within a matter of months.
The transaction renewed attention on the company’s treasury strategy while also raising questions about whether additional sales could influence market sentiment.
At the same time, Bitcoin has shown stronger short-term price action by recovering above its 20-day exponential moving average, although it continues to trade below several longer-term technical levels.
Strategy’s Bitcoin Sale Draws Market Attention
Strategy’s latest Bitcoin sale was considerably larger than its previous disposal in early June, when the company sold 32 BTC. The latest transaction involved 3,588 BTC, prompting market participants to examine whether the move could affect both the company’s long-term accumulation strategy and Bitcoin’s near-term price direction.
The earlier June transaction coincided with a sharp decline in Bitcoin’s market price over the following days. During that period, Bitcoin fell from above $73,000 to approximately $60,000 within a week. While several market factors were present at the time, the company’s sale became one of the developments tracked by investors.
The latest sale also renewed attention on Strategy’s financial structure. The firm has been building up its Bitcoin reserves through funding rounds, making the crypto its key treasury reserve asset.
Nevertheless, preferred securities and borrowings make for periodic cash outflows, while Bitcoin does not generate revenue.
Based on the strategy, such obligations can be financed by way of raising more funds, borrowings, equity financing, and even sales of Bitcoin if there is no other source of money.
Strategy has also come up with a scheme through which they can make as much as $1.25 billion from monetizing their Bitcoin holdings.
Developments Arising From Strategy’s Sale
- Strategy has sold 3,588 BTC, being its second Bitcoin sale in recent months.
- The company previously sold 32 BTC in early June before Bitcoin experienced a sharp market decline.
- Strategy’s financial obligations have shifted attention toward how future dividend and debt payments may be funded.
Technical Barriers for Bitcoin Price Prediction
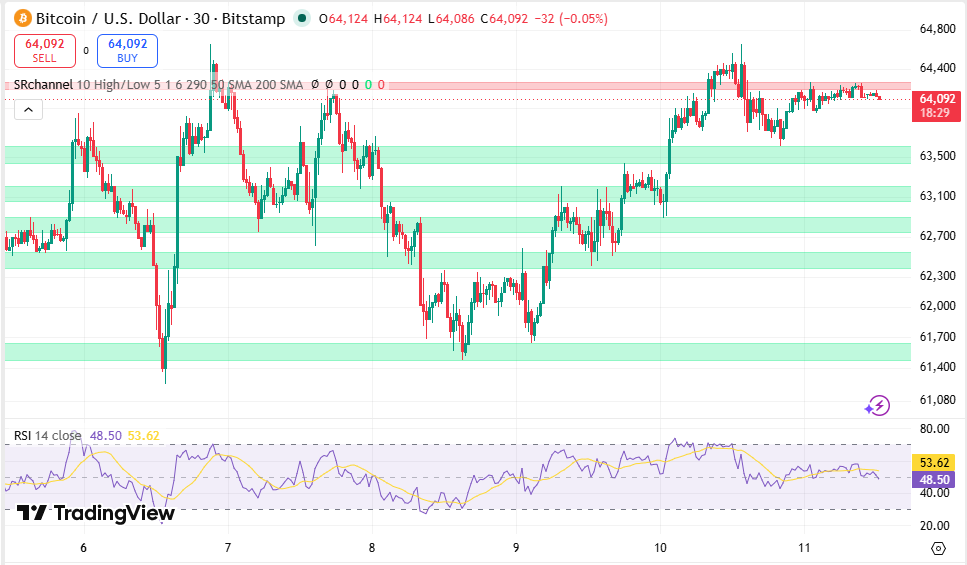
Bitcoin was trading at the level of $64,300, as there is a significant increase in buyers’ interest after a couple of weeks of weak market conditions.
While the short-term outlook of Bitcoin is relatively positive, the overall technical outlook of the coin is still mixed, since the asset is currently trading below several important moving averages.
Source: Trading View
The cryptocurrency has broken above the 20-day exponential moving average at $62,800. Nevertheless, Bitcoin is still below the 50-day, 100-day, and 200-day exponential moving averages.
Resistance is seen near $64,480, with an important one forming between $65,204 and $65,361, where the 0.786 Fib level overlaps with the 50-day EMA. Breaking above that will present higher technical levels to test near $67,242 and then the 100-day EMA near $68,952.
The longer-term resistance remains near the 200-day exponential moving average at approximately $75,049, which continues to represent the upper technical ceiling.
Key Bitcoin Technical Levels
| Level | Significance |
| $64,480 | Immediate resistance |
| $65,204–$65,361 | Fibonacci resistance and 50-day EMA |
| $67,242 | Next upside objective |
| $68,952 | 100-day EMA |
| $73,127 | Higher resistance |
| $75,049 | 200-day EMA |
| $62,767 | 20-day EMA support |
| $61,826–$61,356 | Fibonacci support zone |
| $59,966 | Psychological support |
| $57,719 | Previous swing low |
Momentum Indicators Show Improving Conditions
The Bitcoin Price Prediction also depends on whether current momentum indicators continue improving.
Directional Movement Index readings indicate that sellers still maintain a slight advantage because the negative directional indicator remains above the positive indicator.
However, the distance between both readings has narrowed, suggesting bearish momentum has weakened compared with previous sessions.
The ADX is still hovering around 27, suggesting that the current trend still retains some strength and has not entered a low-volatility phase.
Despite these signs of better times, the signals have not been strong enough for a confirmation of a bullish trend in Bitcoin since it is still trading below multiple resistances.
Technical Signals to Watch
- Bitcoin is trading above the 20-day EMA but below the 50-day, 100-day, and 200-day EMAs.
- The ADX reading near 27 suggests the current trend still has strength.
- A breakout above $65,204-$65,361 would strengthen the technical outlook.
Derivatives and Exchange Activity Reflect Market Consolidation
Derivatives data has changed notably during recent weeks. Bitcoin open interest is now lower compared to more than $90 billion previously reported, dropping to around $45.9 billion.
Even with this reduction, total open interest continues to be higher than historic lows, revealing active participation within the derivatives market.
The spot exchange volume has also become more balanced with previous sessions having withdrawals on exchanges of more than $500 million and even reaching up to more than $1 billion.
Exchange volumes have been stable with lower volumes in both directions being observed. The last known net flow of $27 million is a sign that there is not much selling but a general distribution in the market.
Bitcoin Price Prediction Is Based on Breakout Confirmation
The existing Bitcoin Price Prediction is based on the ability of buyers to penetrate the resistance zone $65,204 – $65,361. A successful move above that range would shift attention toward $67,242, followed by the 100-day exponential moving average at $68,952 and the higher resistance near $73,127.
On the downside, the 20-day exponential moving average near $62,767 remains the first support level.
Additional downside protection is located near $61,826, $61,356, and $59,966. If those levels fail to hold, the previous swing low around $57,719 becomes the next major technical level.
FAQs
Why is the most recent Bitcoin purchase from Strategy getting all the hype?
This was the largest Bitcoin purchase by Strategy since it purchased 32 BTC in the past. This has got everyone interested to know if more Bitcoin purchases might have an effect on market sentiment or not.
What is the most important resistance level on Bitcoin?
The main resistance level lies between $65,204 and $65,361 since here is where the 0.786 Fibonacci Retracement comes into play along with the 50-day exponential moving average.
Which support levels are being watched by traders?
The first support level for Bitcoin lies at the 20-day EMA of $62,767 and then support levels at $61,826, $61,356, $59,966, and the swing low at $57,719.