

- The Bitcoin technical analysis follows the $78,000 level with support at $77,130 and resistance at $80,695.
- The Bitcoin technical analysis indicates support at $77,130, with BTC finding resistance at $80,695 and $82,224.
- The Bitcoin technical analysis states that RSI is at 57.86 while BTC is trading in-between.
Bitcoin’s price stands at $78,298.64, having appreciated by 1.92%, according to the most recent chart, while a different measure indicates that its price is at $78,080.93 and has decreased by 1.61%.
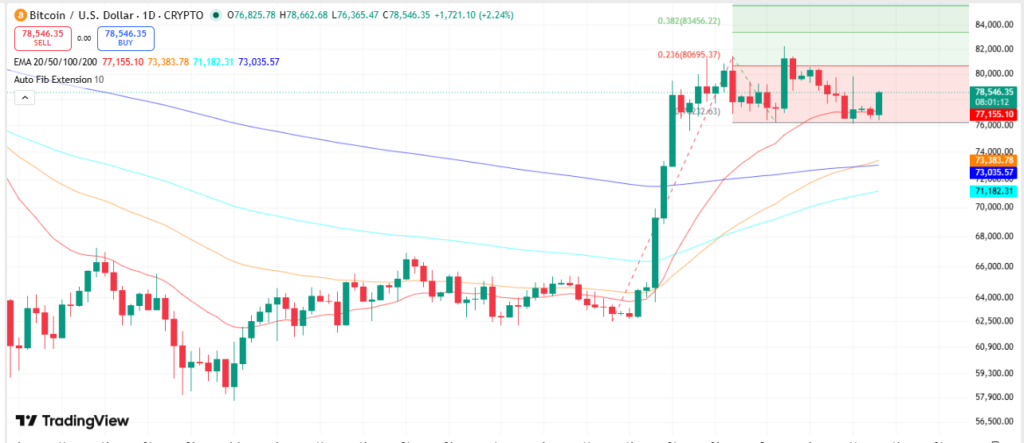
The daily Trading View chart indicates that Bitcoin is consolidating its position after a rise above the $66,000 support level to the $80,000 level, having previously touched $79.59K before falling to $76.5K and then recovering toward $78,000. The latest structure places Bitcoin above former resistance, with the recent peak at $82,224.57 marking a major overhead level.
Bitcoin Technical Analysis Indicators & Moving Averages
The daily chart of Bitcoin shows that its price is oscillating around the 20-day Simple Moving Average (SMA), which is standing at $78,465. At the reported price of $78,188 in that chart reading, the SMA remains an immediate dynamic resistance level. The position of price relative to this average provides a short-term reference point for the current consolidation.
The chart also identifies a 20-day Exponential Moving Average (EMA) at $77,130.61 as immediate support. Bitcoin is trading above this level in the latest readings, with the EMA aligning with the lower boundary of a recent consolidation box spanning approximately $76,000 to $81,000.
 Source: Trading View
The longer-term exponential moving averages remain below the current price. The 50-day EMA stands at $73,373, while the 200-day EMA is $73,033 and the 100-day EMA is $71,177. The chart describes these averages as being in bullish alignment, with each positioned below the reported Bitcoin price.
The moving-average structure therefore places the current market price between immediate dynamic levels near $77,130.61 and $78,465, while the longer-term averages remain considerably lower.
Bitcoin Support and Resistance Boundaries
The chart identifies several technical thresholds around Bitcoin’s current range. The Fibonacci extension point at 0.236 is at $80,695.37 and is placed above the present level. The next Fibonacci point is the 0.382 extension at $83,456.22.
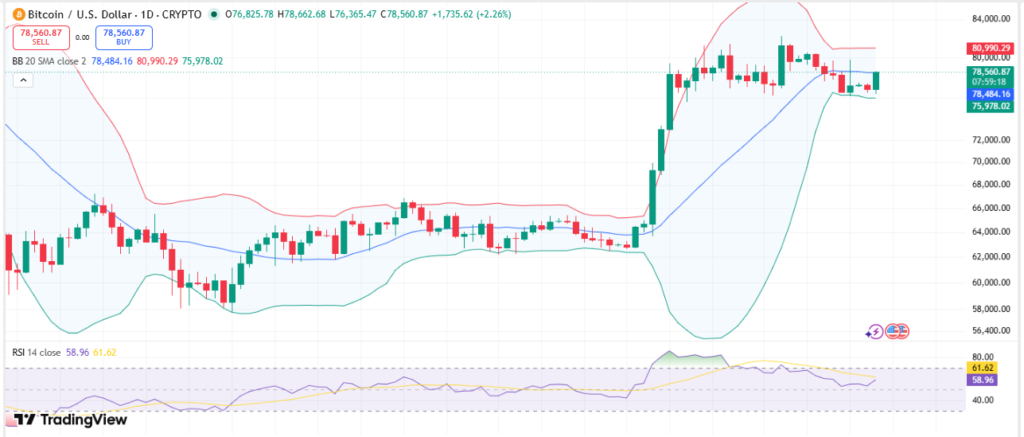
The upper Bollinger Band is positioned near $80,974, adding another overhead technical boundary. This places the upper band close to the 0.236 Fibonacci extension and below the $82,224.57 recent peak.
Source: Trading View
However, a major problem is that the lower Bollinger Band at $75,956 is an instant support on the daily chart data. In addition, lows of the recent candles coincide with this level. On the other hand, a $77,130.61 20-day EMA is another higher support level, and the recent consolidation box stretches to around $76,000.
Another broad support level can be seen at $62,488.01. The chart presents this level as key support, while $82,224.57 represents major overhead resistance.
Bitcoin Momentum and Volatility Analysis
Bitcoin’s Relative Strength Index (RSI) is reported at 57.86. The indicator has cooled from overbought levels recorded during the earlier expansion, leaving the current reading as a neutral-to-bullish momentum reference within the supplied chart data.
The RSI reading is accompanied by a price structure that remains above several major moving averages. At the same time, Bitcoin is positioned slightly below the 20-day SMA in one chart reading, showing that short-term price action remains within a defined technical range rather than clearly above all immediate resistance levels.
Bollinger Bands provide additional boundaries for the current setup. The upper band at $80,974 is the upper limit of volatility. The lower band at $75,956 is the lower limit of volatility. Bitcoin’s current price near $78,000 therefore sits between these two levels.
The supplied data also identifies the $76,000–$81,000 area as a recent consolidation box. Bitcoin’s recovery from around $76.5K toward $78,000 has kept the price within that broader range.
Strategy Maintains Bitcoin Holdings
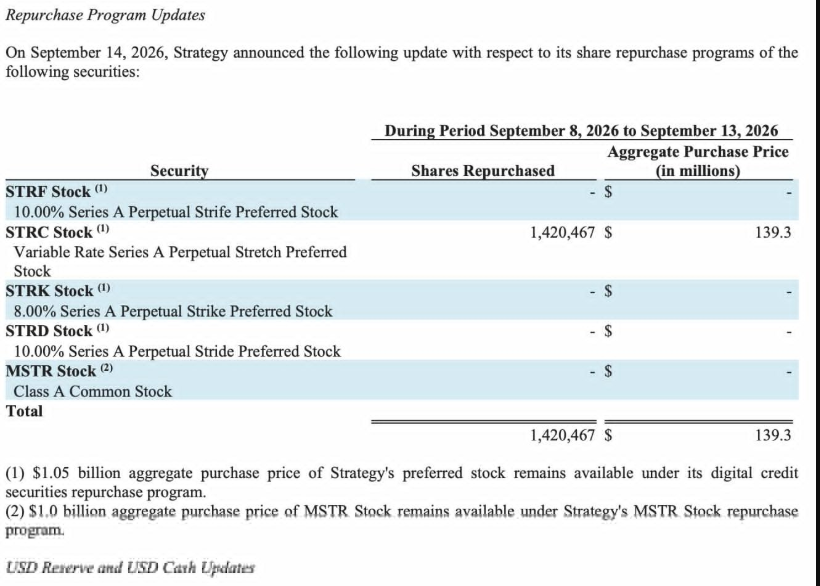
Strategy reported no Bitcoin purchases or sales between Sept. 8 and Sept. 13 while allocating $139.3 million toward repurchasing its STRC preferred stock. During the period, the company repurchased 1,420,467 STRC shares and made no sales through its at-the-market stock programs.
Source: Wu Blockchain
Following the reporting period, Strategy held 845,050 BTC, acquired for approximately $63.73 billion, at an average purchase price of $75,412 per Bitcoin. The supplied figures show that the company’s average acquisition price remains below the latest Bitcoin price readings.
The previous reporting period also involved no Bitcoin purchases, while Strategy spent $176.3 million on roughly 1.81 million STRC shares and increased its Digital Credit Securities Repurchase Program from $1 billion to $2 billion. Across the two reporting periods, the company therefore spent more than $315 million on STRC repurchases.



