

- BTC price jumped by 2.08% to $81,037.66 from its recovery above $76,500 level, and the volume was $43.94 billion.
- The spot Bitcoin ETF witnessed $730.9 million inflow since the BTC was back to $80,000 level with IBIT leading Thursday buying.
- The RSI reading of the Bitcoin price is at 72 while CryptoQuant identified $82,300 as the next major test for BTC now.
Bitcoin price has climbed back above $81,000 after recovering from a weekly low near $76,500, with strong trading activity and renewed demand from U.S.-listed spot Bitcoin exchange-traded funds (ETFs) accompanying the move.
Bitcoin trades at $81,037.66, representing a 2.08% weekly gain, while 24-hour trading volume reached $43.94 billion, up 69.54%. The increase in activity has pushed Bitcoin’s market capitalization to approximately $1.62 trillion.
Bitcoin Price Holds Above Key Moving Averages
The Bitcoin price remains above all four key exponential moving averages highlighted on the daily BTC/USD chart. The 20 EMA stands at $75,813.36, followed by the 200 EMA at $72,504.01, the 50 EMA at $71,099.83 and the 100 EMA at $69,659.31.
The 20 EMA has moved sharply above the 200 EMA after Bitcoin broke out from the $65,000 range. The chart data identifies the structure as an accelerating macro uptrend, with the moving averages creating several potential support layers beneath the current market level.
Source: Trading View
Bitcoin’s Relative Strength Index, or RSI, is at 72.04. That reading places the indicator in overbought territory while reflecting the strength of recent buying activity. The technical setup also identifies the area around $81,000 as a potential point for short-term consolidation.
Bitcoin Price Extends Beyond Major Fibonacci Levels
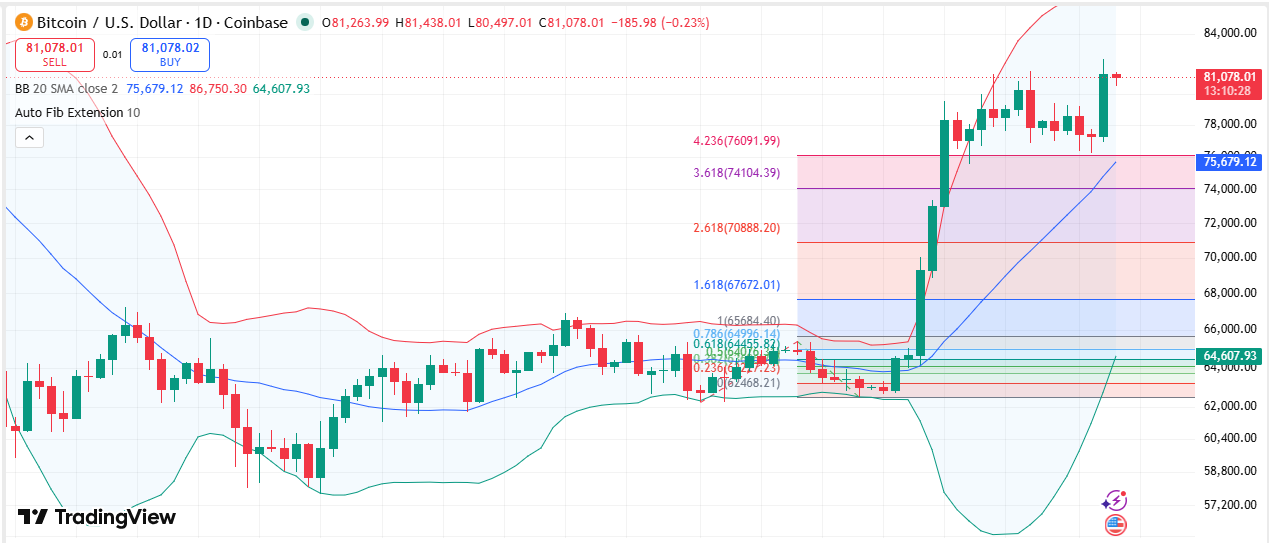
The daily Bitcoin chart also shows BTC trading above the middle Bollinger Band, with the 20-day simple moving average at $75,680.46. The upper Bollinger Band is positioned at $86,754.27, while the lower band stands at $64,606.65.
Bitcoin has moved beyond several Fibonacci extension levels identified in the chart. The cryptocurrency passed the 2.618 extension at $70,888.20, the 3.618 extension at $74,104.39 and the 4.236 extension at $76,091.99.
The $76,000 area is now identified as an important macro support zone in the provided technical data. Bitcoin also broke through previous resistance near $66,923.95. That level, along with $62,468.21, is identified as core support for the broader market structure.
Bitcoin Price Gains as ETF Inflows Accelerate
U.S.-listed spot Bitcoin ETFs recorded $730.9 million in net inflows on Thursday, according to SoSoValue data. The figure marked the largest single-day inflow since January 14, when the funds recorded $843.6 million.
The latest inflow followed $101.2 million in net inflows on Wednesday as Bitcoin recovered the $80,000 level. During the week, BTC traded within a range of roughly $76,000 to $81,000 before moving back above $80,000.
BlackRock’s iShares Bitcoin Trust, known as IBIT, accounted for the largest share of Thursday’s inflows. The fund recorded $454 million in net inflows, representing about 62% of the total daily inflow.
ARK Invest and 21Shares’ ARKB recorded $137.7 million in inflows, while Fidelity’s FBTC attracted $74.4 million. VanEck’s HODL and WisdomTree’s BTCW were the only funds listed as recording outflows, at $19.6 million and $5.2 million, respectively.
Despite Thursday’s strong ETF activity, CryptoQuant cited weaker spot demand and heavy short covering as factors surrounding Bitcoin’s latest move. The research firm identified approximately $82,300 as the next major test based on Bitcoin’s 365-day moving average.
ETF Demand Meets Elevated Technical Momentum
The latest Bitcoin price movement combines increased ETF inflows with elevated momentum readings on the daily chart. Trading volume reached $43.94 billion over 24 hours, while the RSI remained above the level associated with overbought conditions.
The technical data also places Bitcoin above multiple moving averages and extended Fibonacci targets. Meanwhile, the ETF figures show that Thursday’s inflows reached their highest level since January, although individual funds recorded different flows.
IBIT’s Thursday inflow of $454 million was also below its $503 million inflow recorded on August 20. The difference shows that the latest aggregate ETF inflow record was accompanied by varying levels of activity among individual funds.
FAQs
What is the current Bitcoin price?
Bitcoin trades at $81,037.66 based on the provided market data.
How much did Bitcoin gain over the week?
Bitcoin is up 2.08% over the week after recovering from a low near $76,500.
How much did spot Bitcoin ETFs receive?
U.S.-listed spot Bitcoin ETFs recorded $730.9 million in net inflows on Thursday.
What is Bitcoin’s RSI?
Bitcoin’s RSI is 72.04, placing the indicator in overbought territory.



