

- Bitcoin has historically been losing an average of 10% each August month in the past four years, and the pattern is now playing out.
- Bitcoin has fallen below the major moving averages, and traders are reluctant to buy with critical resistance zones.
- Weak demand and ETF flows have led Bitcoin to stabilize above the significant support level.
Bitcoin August Performance has once again become relevant as some historical data about the market showed a regular drop in Bitcoin price in the mentioned period.
Bitcoin is now trading near the $63,000 mark after experiencing significant price correction, while numerous technical analysis tools have pointed out that the cryptocurrency will remain under pressure in the short term.
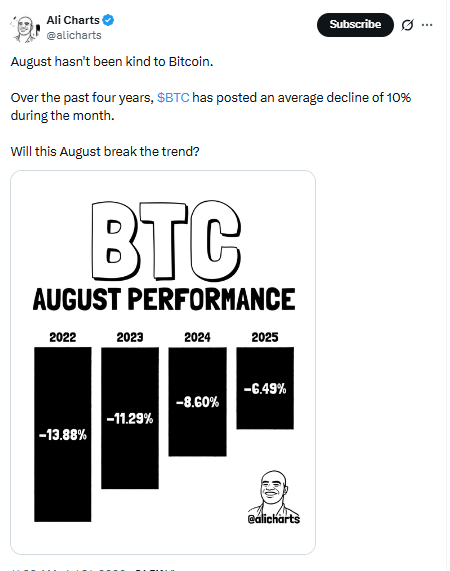
Crypto analyst Ali Martinez said that Bitcoin was experiencing a 10% fall on average in the month of August in the last four years with consecutive monthly losses from 2022 to 2025.
Bitcoin August Performance Has Seen Four Consecutive Years of Losses
As per Ali Martinez, the data shows negative performance for the Bitcoin price in August every year in the last four years.
The data shows a fall of 13.88% in Bitcoin in August 2022 and a fall of 11.29% in August 2023. The trend continued with an 8.60% decline in August 2024, while August 2025 ended 6.49% lower.
Source: Crypto analyst Ali Martinez
Based on those results, Martinez said Bitcoin has averaged a decline of approximately 10% during August over the four-year period.
The data spans different market environments and follows separate trading cycles, yet each August concluded with a negative monthly performance. Martinez presented the figures as Bitcoin entered another August trading period while the market remained under pressure.
Key historical observations
- Bitcoin recorded August losses in each of the past four years.
- The average monthly decline over the period was approximately 10%.
- The reported losses ranged from 6.49% to 13.88%.
Bitcoin Price Holds Above Support Following Sharp Sell-Off
Bitcoin traded near $62,972 after falling 1.28% over 24 hours, according to the latest market data. The move came after a heavy selling wave that erased previous profits as the asset found a floor near the $62,500 area.
Volume has dropped 15.95%, reflecting reduced participation in the market amid the attempted recovery.
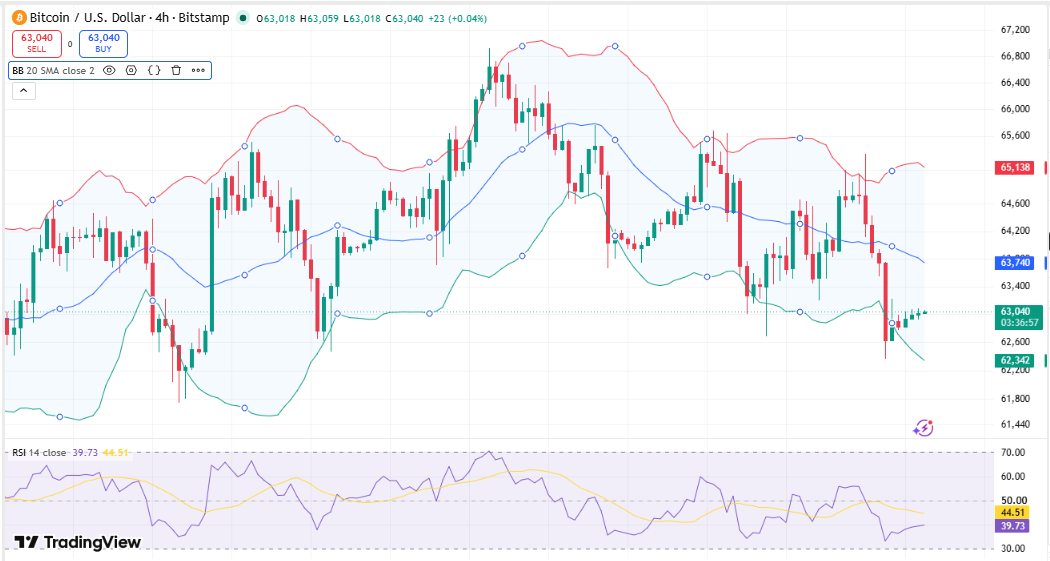
From the four-hour chart, Bitcoin was below the 20, 50, 100, and 200 exponential moving averages that ranged between $63,609 and $64,166. Price’s position below these moving averages pointed to a bearish momentum on the short term.
The Relative Strength Index was 38.70 and was trading below the neutral level of 50.
Source: Trading View
The immediate support level was $62,600 to $62,684 while there were multiple resistance levels at $63,812, $63,953, $64,186, $64,419, and $64,750.
Technical levels monitored
- Support remained between $62,415 and $62,684.
- Resistance extended from $63,812 to $65,680.
- The Fibonacci 1.618 extension was located near $66,393.
Bitcoin August Performance Coincides With Weak Market Indicators
The seasonal data emerged while several additional market indicators remained negative.
According to the provided information, apparent demand has stayed negative for more than 200 consecutive days. Coinbase Premium Index is also trading below zero for several weeks, implying weak pricing relative to other exchanges.
Spot Bitcoin ETFs have simultaneously recorded consecutive weeks of net outflows, reflecting continued capital withdrawals from those investment products during the period.
Separately, market commentator Peter Schiff stated that he expects a larger Bitcoin sell-off as he projected that weakness in the broader technology sector could extend into cryptocurrency markets.
The reported market indicators and historical August data arrived as Bitcoin attempted to stabilize following its recent decline, with prices holding above nearby support but remaining below multiple technical resistance levels.
FAQs
Why is Bitcoin August Performance receiving attention?
Historical data shared by Ali Martinez shows Bitcoin averaged a 10% decline during August over the previous four years.
What are Bitcoin’s current support and resistance levels?
Support is seen between $62,415 and $62,684, while resistance is between $63,812 and $65,680 with an additional Fibonacci Extension at $66,393.
Which factors are presently exhibiting weakness in the market?
Negative apparent demand for more than 200 days, negative Coinbase Premium Index, successive Bitcoin ETF outflows on the spot, and a price level of Bitcoin below its crucial exponential moving averages are some of them.



