

- The Bitcoin price was above $64K, but still in a narrow range, due to the balance in the momentum.
- The strategy incurred a loss of $8.22 billion for the quarter and also bought more Bitcoins during the year.
- The futures implied long bias as well as high open interest before the breakout.
The price of Bitcoin moved higher above $64,300 despite a recent retreat from the $65,200 mark, while Strategy posted an $8.22 billion net loss in the second quarter, which was mostly driven by paper losses in its Bitcoin portfolio. Meanwhile, derivatives markets were indicating a bullish bias, but the technicals pointed towards a market consolidating in a specific range.
Bitcoin Price Prediction Signals Consolidation Above Support
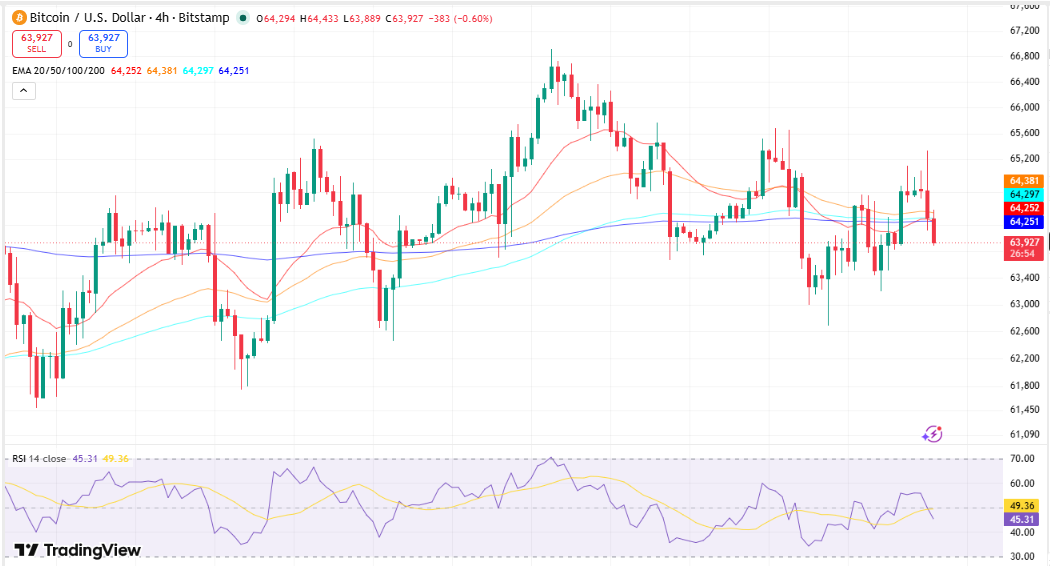
The price of Bitcoin reached $64,317, up 0.63% compared to the last 24 hours. In the process, Bitcoin reached $65,200 before the buyers sold off the coin, bringing the price below $64,300.
Bitcoin was trading near $64,396 on the four-hour time frame after retracing from its lows. The price was above the 100-day exponential moving average (EMA) level of $64,342 and the 200 EMA level of $64,265 but was below the 20 EMA level of $64,547 and the 50 EMA level of $64,293. The positioning of moving averages was indicative of short-term weakness despite support from trend indicators over a longer period.
Source: Trading View
The RSI index was around 50, meaning that the momentum was equally distributed between buyers and sellers.The price was in a range of roughly $64,300-$64,900 as shown in recent candlesticks.
Technical Support was seen at $64,250, with wider support at $64,000. Resistance continues to be seen at the range of $64,900-$65,200 and another resistance level is set at $65,680.
Key Technical Levels
- Support stands at $64,250, with further support at $63,128 and $62,684.
- Resistance can be seen from $64,900 to $65,680.
- RSI at 50 indicates neutral momentum
Further technical indicators were also indicative of low volatility.
The price of Bitcoin stood at $64,368 and was trading slightly above the midpoint of the Bollinger Bands at $64,050 but below the upper Bollinger Bands at $64,973. This indicated that there was no enough momentum in the price to test the upper level of volatility.
The lower Bollinger Band stayed close to $63,128, forming yet another area of technical support on the chart. The price action within the middle and upper Bollinger Bands was consistent with the wider consolidation trend.
The combination of moving averages, Bollinger Bands, and RSI continued to show a market trading within established boundaries rather than producing a confirmed directional breakout.
Strategy Expands Bitcoin Holdings Despite Quarterly Loss
Strategy reported an $8.22 billion net loss during the second quarter, driven primarily by an $8.32 billion unrealized loss on its Bitcoin holdings as Bitcoin prices declined during the reporting period.
Bitcoin fell approximately 14% during the quarter, moving from around $68,000 at the beginning of April to roughly $58,600 by the end of June, according to the data provided.
As of July 26, Strategy held 843,775 BTC, representing a 25% increase from the beginning of the year.
The company also disclosed that it sold approximately $218.4 million worth of Bitcoin under its recently established BTC monetization program to fund part of its preferred stock dividend obligations. Of that amount, approximately $216 million was sold in early July after the second quarter had ended.
Strategy further reported building a $3.75 billion U.S. dollar reserve, which it said is sufficient to cover more than two years of preferred dividend payments and interest obligations.
The company also repurchased $25 million of its STRC preferred shares below par value and stated it intends to continue repurchasing those securities while they trade below $100.
Source: Yahoo Finance
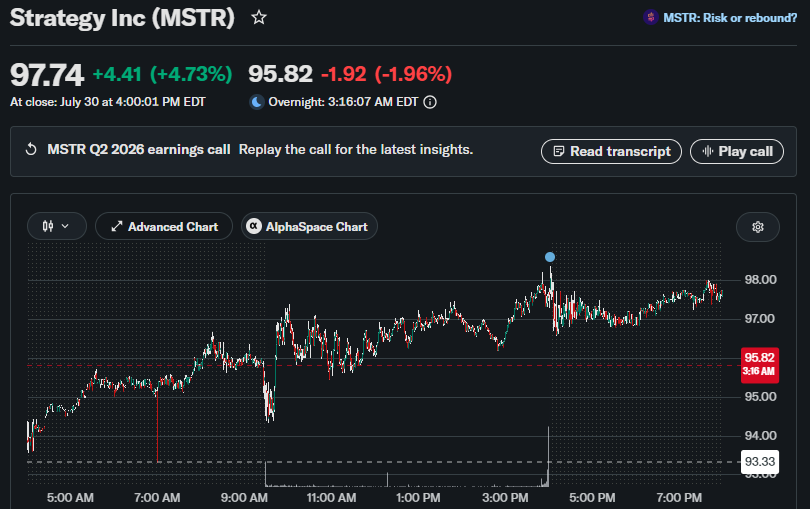
Strategy shares closed the regular trading session 4.7% higher before declining modestly during after-hours trading following the earnings release.
Bitcoin Derivatives Data Shows Long Bias
Bitcoin price prediction also reflected activity across derivatives markets.
The long-short ratio was still above 1.4 on all the major exchanges, meaning that the number of longs was greater than shorts. New liquidation numbers also indicated that there were more short positions that got liquidated compared to long positions.
The open interest was high but had fallen compared to previous numbers. These two combined together with trading within a range implied active participation in Bitcoin futures trading within technical price levels.
FAQs
What is the current trading range of Bitcoin?
The current trading range of Bitcoin has been around $64,300 to $64,900, after a fall from almost $65,200.
What are the support and resistance zones observed?
Some support zones are $64,250, $63,128, and $62,684, while some resistance zones are between $64,900 to $65,68.
Why did Strategy record a quarterly loss of $8.22 billion?
The company said the loss was primarily driven by an $8.32 billion unrealized decline in the value of its Bitcoin holdings during the second quarter.



