

- BNB has managed to break above important support level and now trading at $567 with neutral and steady momentum.
- Franklin Templeton is currently managing tokenized assets worth $1.5 billion on BNB chain.
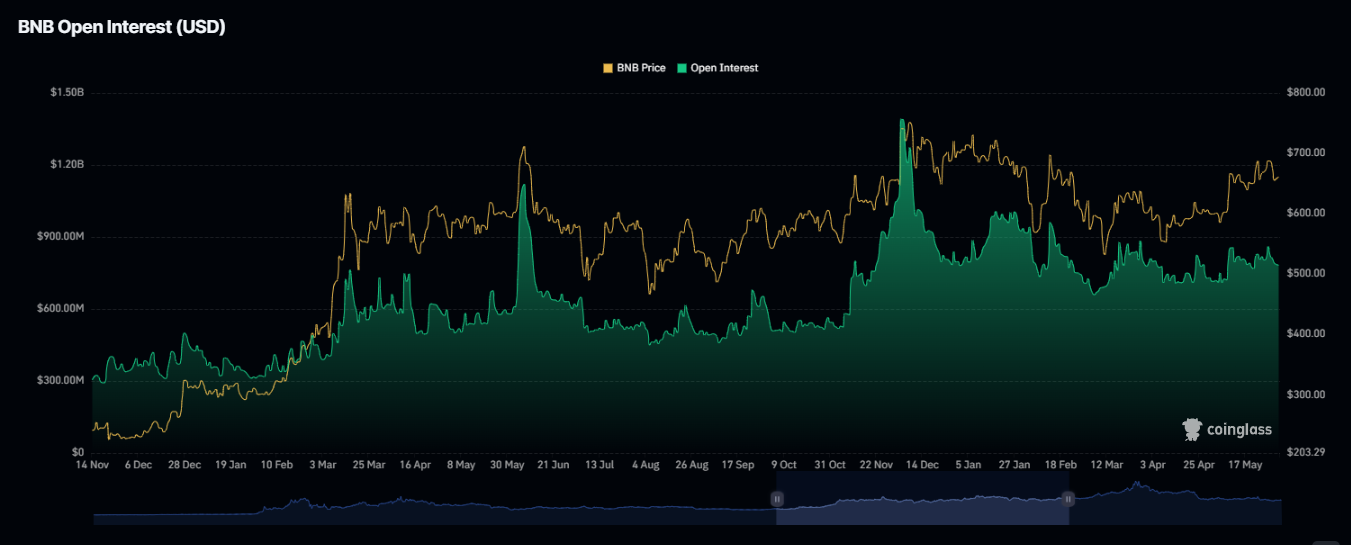
- BNB futures traders are bullish but constant open interest levels suggest that consolidation persists.
The price of BNB still revolves around how the token will sustain the ongoing recovery process after it stabilizes above recent lows and the institutional trading on BNB Chain is on the rise.
Over the past 24 hours, BNB was seen bouncing back from an intra-day drop below $557 and settling above the $567 mark, which saw trading consolidate further. Also, derivatives data showed that the market had more long positions than short positions, while open interest stayed constant in the month of July.
BNB Price Forecast Considers Ongoing Recovery Following Intra-Day Drop
BNB was trading at $567.81, recording a 0.59% gain over the last 24 hours after bouncing back from a huge sell-off. The token was seen dipping below the $557 mark but then rising above $568 again.
Market capitalization was $75.61 billion and 24-hour trading volume was $1.1 billion, which showed a 4.87% gain in the same time frame.
The bounce came after a volatile period without developing further as an uptrend, rather entering a sideways consolidation pattern, which implies that buyers had become exhausted following the bounce up.
Resistance Holds Despite Technical Indicators
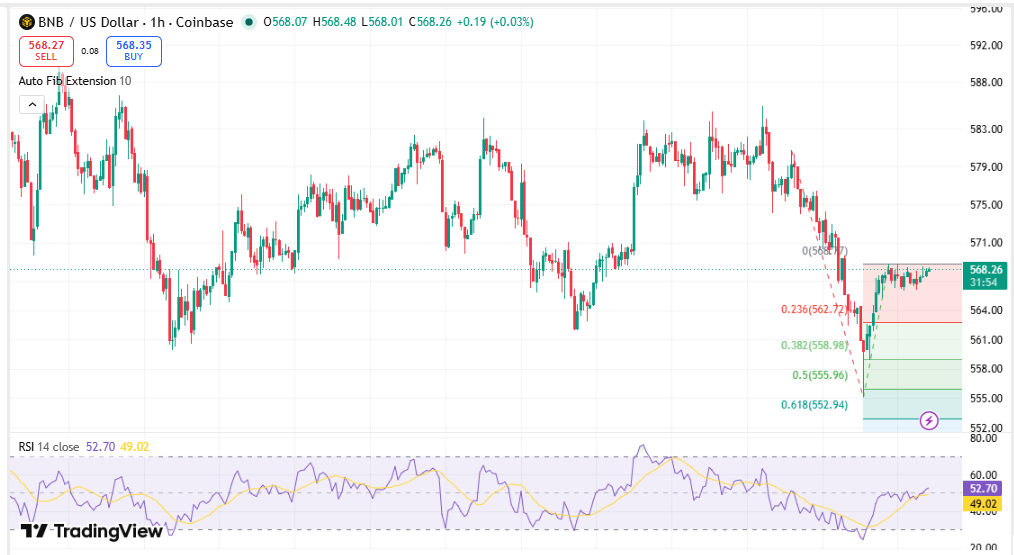
Looking at the one hour timeframe, BNB is trading at $567.37 and is sitting under a cluster of exponential moving averages.
Source: Trading View
Technical Levels Considered Were:
- 20 EMA: $567.19
- 50 EMA: $569.39
- 100 EMA: $571.65
- 200 EMA: $572.69
Despite the token being able to bounce back from the drop down to $555, the coin continued trading below the general moving averages, suggesting that the resistance level was still located above the price level.
At the same time, the Relative Strength Index (RSI) stood at 49.02, representing neutral momentum.
The presence of neutral RSI values and prices below several moving averages indicated that BNB had stabilized, but had not yet escaped from the resistance levels around it.
Fibonacci Levels Indicate Short-term Support
A different one hour Fibonacci analysis of BNB indicated that it had recovered from its lows to above several Fibonacci retracement levels.
These include:
- 0.618 Fibonacci level
- 0.500 Fibonacci level
- 0.382 Fibonacci level
After the bounce, BNB held above the technical levels but also remained close to the 0.236 retracement level at $562.72.
This was evident from the chart, where price maintained its recovery as long as it traded above nearby support levels. Also, the consolidation phase highlighted the fact that there had been no formation of new directional trend apart from the latest recovery.
Derivatives Indicate Bullish Sentiment on Steady Open Interest Levels
From the derivatives data, it was clear that bulls were dominant in the trade.
The long-to-short ratio on Binance for BNB/USDT was 2.91 and 2.96 on OKX, implying an excess of long positions over short ones in both exchanges.
On Binance, the account-based long-to-short ratio among the biggest traders amounted to 3.21 but position-based long-to-short was only 1.65.
The liquidation statistics were no exception.
In the past 24 hours:
- Total liquidations: $528.55K
- Long liquidations: $491.97K
- Short liquidations: $36.58K
A greater number of long liquidations was indicative of leveraged bull positions dominating in terms of forced liquidations within the given time frame.
Additionally, according to CoinGlass data, the open interest of BNB was fluctuating in the range of $850 million to $900 million in July. The stability of the range indicated that the derivatives players did not change their positions amid the volatility of the day.
Source: Coinglass
Franklin Templeton Adds Tokenized Assets to BNB Chain
Apart from price action, BNB Chain has seen another institutional update concerning tokenized assets in the real world.
Franklin Templeton revealed that their Benji Investments arm is managing $1.5 billion worth of tokenized assets on BNB Chain.
This puts BNB Chain at the forefront of blockchain networks where one of the biggest asset management firms offers tokenized products.
According to the press release:
“This makes BNB Chain the dominant blockchain ecosystem for tokenized offerings by one of the world’s largest asset management firms.”
The update comes amid an increasing number of developments that see the platform actively engaged in financial products backed by blockchain technology built around traditional assets.
BNB Price Prediction: Consolidation Period in the Spotlight
At the moment, the forecast for BNB price is consistent with the trading dynamics in the consolidation pattern after a recovery from recent drops.
Conversely, the RSI value at 49 suggests that there is a lack of strength in momentum, and the derivative markets data still shows long trades outpacing short trades despite the open interest staying roughly the same at levels ranging from $850 million to $900 million through July.
FAQs
What is the recent BNB price forecast according to the latest data?
Market data shows that the BNB coin is currently being traded around $567 after bouncing from below $557.The asset has recovered several Fibonacci support levels but has yet to break above the short-term exponential moving average lines.
What causes BNB to trade below its moving averages?
Based on the hourly chart, BNB is still trading below its 20, 50, 100, and 200 EMAs, where these EMA lines can be considered resistance. Despite the latest bullish move that has helped to stabilize the price, the token hasn’t broken above these technical lines.
What does RSI mean for BNB?
Relative Strength Index (RSI) is at 49, which means that the momentum of the coin is neutral.



