

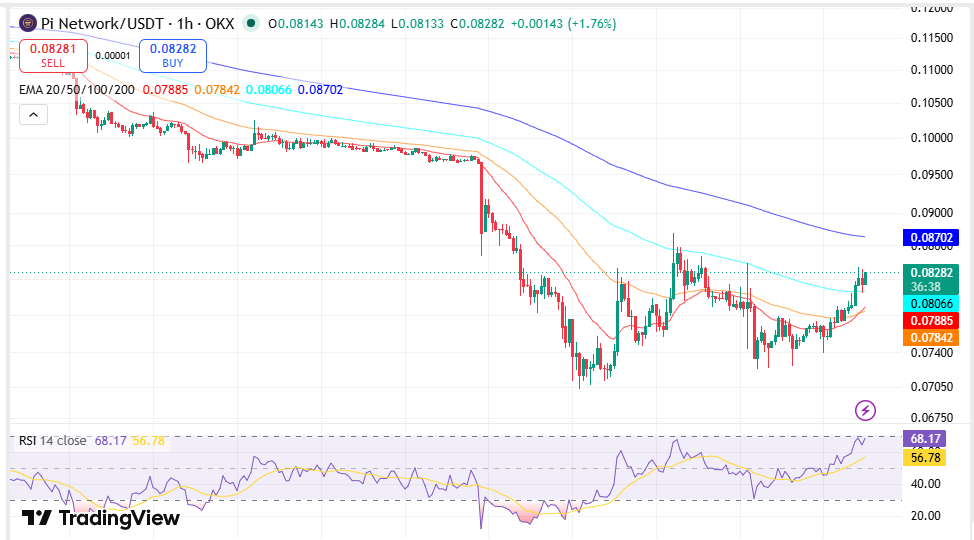
- PI crossed over the three hourly EMAs and buyers regained short-term momentum ahead of the Protocol v25 launch.
- Price resistance is still solid and the price is trading under the 200 EMA despite the recovery.
- Protocol v25 will be launched on July 22 and includes Zero-Knowledge capabilities for the Pi Network.
Pi Network stays in the limelight due to the positive change of 24 hours for PI that occurred when technicals and a future upgrade of the protocol continued capturing the interest of the trading community.
The coin was being sold at a price of $0.08232, having gained 8.67% in value within 24 hours.At the same time, the project confirmed that Protocol v25 will activate on July 22, introducing new cryptographic features to the network.
Pi Network Price Prediction Signals Improving Short-Term Momentum
The latest 24-hour chart showed PI climbing steadily after several temporary pullbacks before accelerating higher during the final hours of trading. The move lifted the token to approximately $0.08232, while its market capitalization reached $900.81 million.
During the same period, 24-hour trading volume measured $16.98 million, representing a 24.2% decline compared with the previous day. Notwithstanding the lower volumes, there was an indication of further increase in price, with the biggest increase coming toward the latter part of the trading session.
PI was trading at $0.08186 on the one-hour TradingView chart after it recovered from the recent drop below $0.073. There is also an indication of prices increasing above the 20-period Exponential Moving Average (EMA) of $0.07848, 50 EMA of $0.07826, and the 100 EMA of $0.08063.
Source: Trading View
There was still an indication that the token had not crossed above the 200 EMA of $0.08706.
Key Short-Term Developments
- PI made gains of 8.67% over the past 24-hour period.
- Price climbed above the 20 EMA, 50 EMA, and 100 EMA.
- Trading volume declined despite the upward move.
- The 200 EMA remains the next major technical hurdle.
Daily Chart Continues to Show Major Resistance Levels
Although recent price action improved on shorter timeframes, the daily chart continued reflecting the broader decline that has developed since May.
The PI hovered around the lower Bollinger Band at $0.06993 after a consistent decline from levels of over $0.20 recorded in the early part of the year. The Bollinger Band midline at $0.10205 constitutes the first major resistance point above the prevailing price level.
The next major resistance area is located at the upper Bollinger Band near $0.13417, which coincides with the descending trendline that has capped each attempted bounce from the $0.30 high in April.
The chart indicated that the descending trendline is still setting the market structure by capping each bounce attempt below the preceding highs.
Pi Network Technical Levels, Summary
| Indicator | Leverage | Market Movement |
| Price | $0.08232 | Increased by 8.67% over 24 hours |
| Market Cap | $900.81 million | Represents market valuation for network |
| Volume | $16.98 million | Down 24.2% from previous day |
| 20Exponential Moving Average | $0.07848 | Current price is trading above this level |
| 50 Exponential Moving Average | $0.07826 | Acts as a short-term support |
| 100 Exponential Moving Average | $0.08063 | Momentum is still higher than this average |
| 200 Exponential Moving Average | $0.08706 | Main hourly resistance |
| Lower Bollinger Band | $0.06993 | Main support |
| Bollinger Midline | $0.10205 | First daily resistance |
| Upper Bollinger Band | $0.13417 | Extended resistance |
| RSI Divergence | 18.81 | Bullish divergence remains unconfirmed |
| Parabolic SAR | $0.07416 | Bullish reading on the hourly chart |
| MACD | Bullish crossover | Positive short-term momentum |
Technical Indicators Show Mixed Signals
There were a number of technical indicators that suggested better near-term prospects without signaling a broader reversal of the trend.
RSI Divergence Indicator at 18.81 gave a bullish divergence in July. Such a situation was witnessed prior to the previous rally in February as well. Unlike the earlier instance, in this case, the formation of a divergence did not lead to any reversal in prices.
Prices kept moving near the lower Bollinger Band even though RSI is stabilizing. In addition, the hourly chart gave further short-term trends. The Parabolic SAR at $0.07416 fell below the prevailing market price level, giving a bullish trend for the hourly period.
Furthermore, the MACD trended to the positive side; the MACD line at 0.00042 crossed over the signal line at 0.00002. At the same time, the histogram showed a change from red candles to green ones, signifying an improving trend in the short-term momentum after the decline towards the $0.0700 level.
Technical Signals
- RSI divergence is currently ongoing without price confirmation.
- Parabolic SAR has flipped below price on the hourly timeframe.
- MACD has generated a bullish crossover.
- Price remains below the 200 EMA and daily resistance levels.
Support and Resistance Levels Clearly Identified
The technical levels prevailing currently still continue defining these regions for the traders. Immediate support remains at the lower Bollinger Band near $0.06993, together with the psychological $0.0700 level.
The first resistance level stands at the Bollinger Band midline of $0.10205, while the next resistance zone remains at approximately $0.13417, where the upper Bollinger Band intersects with the long-term descending trendline.
On shorter timeframes, the 200 EMA at $0.08706 represents another level that remains above the current price and continues separating the recent recovery from a broader trend change.
Support Levels
- $0.06993 — Lower Bollinger Band
- $0.0700 — Psychological support
Resistance Levels
- $0.08706 — 200 EMA
- $0.10205 — Bollinger Band midline
- $0.13417 — Upper Bollinger Band and descending trendline
Protocol v25 Upgrade Approaches as Next Scheduled Event
The Pi Core Team confirmed that Protocol v25 will become active on July 22, ending approximately six weeks without a major protocol announcement.
According to the project, the upgrade introduces BN254 cryptography together with Poseidon hashing, technologies designed to support zero-knowledge applications that allow sensitive information to be verified without revealing the underlying data.
The announced applications include identity verification systems and private proof mechanisms. The Core Team also requested that node operators complete their software upgrades before activation.
Project documentation further stated that the implementation is based on Protocol v25, known as X-Ray on Stellar, which entered production on the Stellar mainnet in January 2026.
The adoption of an implementation already operating on another blockchain means the underlying technology has previously been deployed in production. The project also confirmed that Protocol v26 is planned as a future network upgrade.
Separately, the Pi mining application received its first interface redesign, introducing a revised navigation menu, improved access to the Mainnet Checklist, and a dark mode option for the platform’s reported 60 million active users.
Frequently Asked Questions (FAQs)
What is the current Pi Network price?
The price of PI is moving around $0.08232, indicating a 8.67% increase during the last 24 hours.
What are the important levels of support for PI?
The important levels of support are $0.06993, which is the lower Bollinger Band, and the psychological support level of $0.0700.
What are the resistance levels for PI?
The important resistance levels include the 200 EMA of $0.08706, Bollinger Band midline of $0.10205, and the upper Bollinger Band of $0.13417.



