
- XRP stays on top of the important moving averages, while $1.12 remains the important resistance level.
- XRP Ledger broke through 8 million active accounts as tokenized asset value rose above $4 billion on the network.
- RSI was trading neutrally as XRP defended the support at $1.10.
The price of XRP made another headline as the cryptocurrency moved within $1.10 range on the hints that the market seems to be stabilizing as a result of technical reasons.
The day witnessed XRP rise from its intraday dip to end up trading above $1.10 after closing at a daily upside of 0.17%. From the charts, XRP appeared to be consolidating above important moving averages.
XRP Price Prediction Shows Signs of Consolidation Around Key Technical Levels
XRP was trading around $1.10, its market cap hovering at around $69.2 billion. The total daily volume for XRP was around $1.24 billion, down by 9.44% compared to the past 24 hours.
However, intraday analysis revealed that XRP rose past the $1.12 mark initially before declining slowly throughout the day. It traded below the $1.10 mark temporarily until the buyers took control again for the price to rebound slightly towards the end of the session.
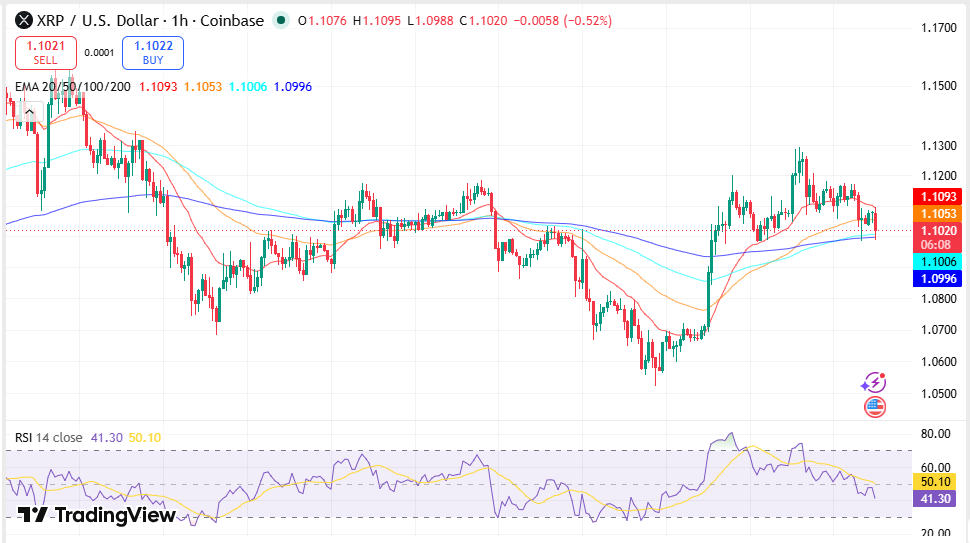
Source: Trading View
Looking at the one-hour time frame, the analysis revealed that the price was consolidating after bouncing off levels around $1.05-$1.06. The price was still trading below the 20-day EMA level of $1.1098 but above the 50-day EMA of $1.1055, 100-day EMA of $1.1007, and 200-day EMA of $1.0997.
Fibonacci Levels and Momentum Oscillators Establish Short-Term View
Technical analysis additionally pointed out several Fibonacci retracement levels which continued to affect the price action of XRP.
The cryptocurrency traded near the 0.236 Fibonacci retracement level, while remaining below the 0.382 and 0.5 retracement zones that continued to act as overhead resistance.
Technical data showed that a sustained move above $1.12 would place attention on the 0.618 Fibonacci retracement level near $1.1202. However, failure to keep the current support levels would mean testing the $1.10 price level again.
Moreover, momentum oscillators showed lack of momentum in either direction. The Relative Strength Index (RSI) was 47.77, while the RSI signal line was 50.56. Given that the RSI was below the RSI signal line, momentum showed decreasing bullish momentum but remained in the neutral range.
Descending Wedge Breakout Waiting to be Confirmed
There was another technical formation that could be observed from the daily chart.
XRP traded somewhat higher than the upper line of the descending wedge formation which has been restraining price action since May. Yet, the price action was still uncertain instead of being decisive.
The confirmation of the breakout did not happen due to the lack of volume which usually occurs after technical breakouts.
As per the technical analysis, the confirmation required:
- Close above the descending wedge on a daily basis.
- Buying pressure backed by strong volume.
The parabolic SAR which was at $1.0451 stayed below the current price, keeping its bullish bias. Conversely, the EMA of 20 days at around $1.1060 was in harmony with the trend line of the broken wedge pattern. This zone kept acting as a crucial technical support during the ongoing consolidation phase.
The test of this level from above would be keeping the existing breakout attempt valid, whereas the daily close below the descending wedge would render it invalid.
XRP Technical Support and Resistance Levels
Technical indicators recognized a number of key levels for ongoing market action.
| Level | Price |
| Immediate Support | $1.1060 (20-day EMA) |
| Secondary Support | $1.0451 (Parabolic SAR) |
| Major Support | $1.00 |
| Initial Resistance | $1.12 (Wedge trendline) |
| Higher Resistance | $1.1549 |
| Extended Resistance | $1.2515 |
These levels kept on determining the range within which the trade was taking place over the recent periods.
XRP Ledger Records Eight Million Activated Accounts
Beyond price action, the XRP Ledger recorded a new network milestone. According to the XRP Ledger Foundation, the network surpassed eight million activated accounts on July 15.
The foundation also reported that:
- More than $4 billion in real-world assets have been tokenized on the ledger.
- AI agents have completed more than one million transactions.
- The network has processed more than 100 million closed ledgers.
Active accounts are those accounts that have been provided with sufficient XRP to meet the required reserve for the system in order to enable transaction submission.
The number of active users is not eight million because one address can be used by exchanges and organizations to manage several customer accounts and vice versa.
Mixed Network Metrics Pointing Toward Stagnation
Despite achieving new heights in terms of the number of accounts, some metrics revealed less active performance in the network.
Active addresses have been declining in recent periods to about 25,350 daily addresses, which is the lowest value recorded in 2026.
In addition, the pace of wallet creation has been reducing after March. Data shows that about 2,300 wallets are being created daily compared to an average of 4,800 wallets per day recorded in the third quarter of 2025.
FAQs
How does the XRP price trend look like currently?
Currently, XRP trades close to $1.10 having formed consolidation patterns above various moving averages. The technical indicator shows that the market is in the process of testing the resistance at $1.12 after recovering from its recent lows.
What are the major support levels for XRP?
The significant support levels include the following: $1.1060 (20-day EMA), $1.0451 (Parabolic SAR), and psychological level at $1.00.
What are the resistance levels being monitored by traders?
The immediate resistance is at $1.12, while the other resistances are at $1.1549 and $1.2515.



