

- The Dogecoin price forecast indicates that the DOGE price would hold above crucial support and resistance levels.
- Options saw a lot of activity, while the interest declined amid the setup for the big move.
- DOGE was trading below critical moving averages due to guidance from the technicals.
Prediction of Dogecoin price still hinges on the ability of the meme currency to hold support levels above its lows despite a prolonged period of losses.Analysis of Dogecoin Price indicates that DOGE is trading around $0.072 following a fall in price.
The technicals were providing contradictory signals at different time frames. Short-term buying interest allowed the token to rebound from its low, but it continued trading below key resistance levels.
On the other hand, the derivatives markets were showing signs of shifts in trader positions as the option trading increased, and open interest decreased.
Dogecoin Price Prediction Shows Recovery Attempt After Extended Decline
DOGE was trading at roughly $0.07214 after recording a 0.14% fall compared to the last 24 hours. In the day, the token was seen falling to as low as $0.0710 before rebounding and stabilizing at about $0.0722.
The market capitalization of DOGE stood at $11.18 billion while its 24-hour spot trading volume stood at $410.81 million. Circulating supply remained at 155.06 billion DOGE.
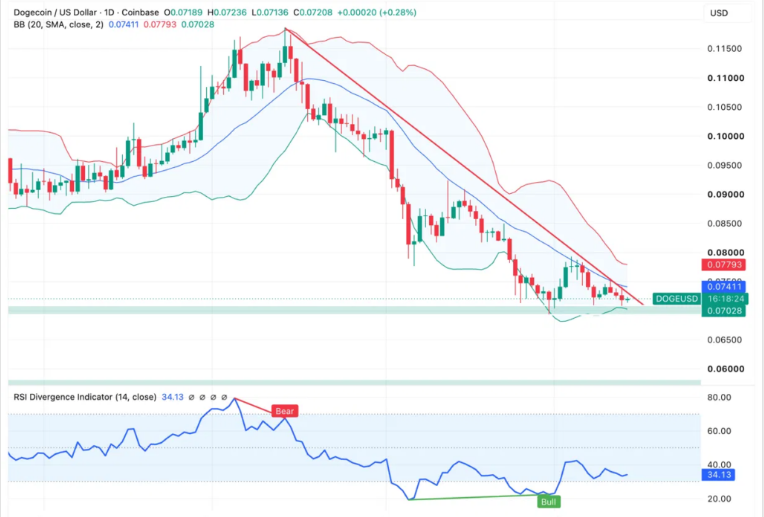
The broader trend has remained under pressure since May. DOGE has declined roughly 37% from its peak near $0.115, leaving the asset below its 20-day Bollinger Band midline, an area that continues acting as overhead resistance.
Source: Trading View
Daily Bollinger Bands showed the lower band positioned at $0.07028, the middle band at $0.07411, and the upper band at $0.07793. Price traded between the lower and middle bands after touching an intraday low of $0.07136, keeping immediate attention on whether current support can continue holding.
Technical Indicators Define Significant Price Zones
There were quite a few technical indicators that defined the current structure in the market but did not indicate any directional breakout.
The daily Relative Strength Index (RSI) divergence reading was 34.13. The bearish divergence which was spotted around the price high in May indicated a fall in the price afterwards, and a bullish divergence was formed in early July when the RSI reached the oversold region despite new lows in price.
The bullish divergence is seen, but trading volume has not confirmed it yet.
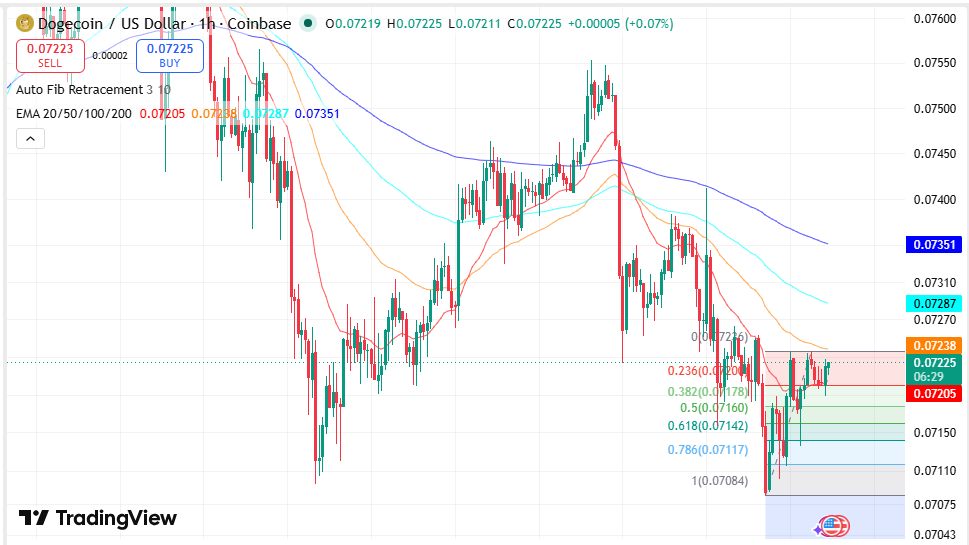
In the one hour chart, Dogecoin was trading at $0.07216, and its price was well below the 20, 50, 100, and 200 exponential moving averages. Meanwhile, the 200 period EMA level was at $0.07351 and acted as the most significant resistance barrier.
Source: Trading View
The price movement was still creating lower high and lower low formations despite the current bounce. While the buyers managed to defend the price level at $0.0710-$0.0715, the bounce was only limited below the key moving averages.
Moreover, further short-term technical analysis of DOGE on the basis of Fibonacci retracement levels confirmed that DOGE was trading around 23.6% retracement at $0.07204
The rebound saw price action rise above the 38.2%, 50%, and 61.8% retracement levels from the recent pullback, implying that short-term momentum was improving. But, DOGE was trading beneath the recent swing high of $0.07226, meaning that resistance levels were still intact.
Dogecoin Key Technical Levels
| Indicator | Level | Significance |
| Current Price | $0.07214 | Trades within proximity of short-term consolidation area |
| Intraday Low | $0.07136 | Immediate support |
| Lower Bollinger Band | $0.07028 | Main support line |
| 20-Day Bollinger Midline | $0.07411 | First resistance level |
| Upper Bollinger Band | $0.07793 | Resistance extension |
| 200 EMA (1H) | $0.07351 | Dynamic resistance |
| Recent Swing High | $0.07226 | First resistance |
| Fibonacci 23.6% | $0.07204 | Short-term retracement support |
| Recent Swing Low | $0.07084 | Recovery starting point |
Daily Chart Maintains Divergent Form
Dogecoin remains trading below the 20-day Bollinger midline in the daily chart while still remaining above the lower Bollinger Band. The bullish RSI divergence formed following the most recent downtrend is still visible without any confirmation from trading volume.
At the same time, the cryptocurrency continues to trade around 37% under its all-time high in May close to $0.115.
Important notes:
- DOGE is trading below the Bollinger midline, maintaining resistance.
- The bullish RSI divergence continues without volume confirmation.
- The bigger picture stays under the May all-time high even with stabilization.
- One Hour Chart Has Resistance Above
Short-term price dynamics continue to indicate bearish dynamics amid DOGE staying below all key EMAs. Support was defended near the $0.0710-$0.0715 area, which prevented the continuation of the decline; meanwhile, 200-hour EMA remains the strongest resistance level.
Divergent Derivatives Market Signals
Mixed signals are coming from the derivatives market. The trading activity went up during the last session, while the open interest remained declining amid traders cutting their positions on margin. Meanwhile, the options activity went up, meaning higher interest in risk management tools.
Main Highlights:
- Volume rose amid the open interest.
- Options volume was more than doubled during the last session.
- The number of long liquidations was much higher than that of short liquidations.
Levels of Support and Resistance Are Clearly Identified
The current technical still form the key basis for the Dogecoin price forecast.
The first level of support is seen at the recent intra-day low around $0.07136, and after that, the lower Bollinger Band can be viewed at $0.07028. The zone around $0.0710 has been the site of significant purchases during the recent trading session.
The first level of resistance is seen at $0.07226, with the 200-hour EMA available next at $0.07351. Further up, the 20-day Bollinger Band midpoint can be considered at $0.07411. The upper Bollinger Band of $0.07793 is the next upside level.
Mixed Positions Shown in Derivatives Data
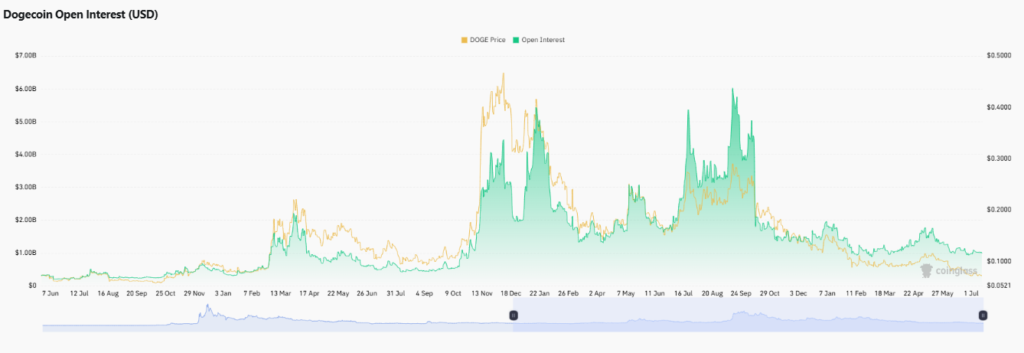
Activity in derivatives gave conflicting messages in the recent trading period. The trade volume rose by 6.54% to $718.21 million. This means that more traders took part in the trades.
Nevertheless, open interest fell by 1.43% to $1.00 billion, showing that current leveraged positions were liquidated but not built up.
Source: Coinglass
On the other hand, options volume surged by 101.75%, revealing a higher utilization of options contracts as traders modified their risk position in an unusually narrow trading range.
Liquidation data revealed that leveraged long positions made up the majority of the losses. Approximately $2.15 million in long positions were liquidated over the previous 24 hours, compared with roughly $210,510 in short liquidations.
Commentary Adds Additional Market Focus
Recent public comments from Morgan Creek Capital founder Mark Yusko introduced another topic being monitored by market participants.
In an interview conducted recently, Yusko compared Dogecoin with other privately held resources, adding that Elon Musk and Mark Cuban own a large amount of Doge tokens.
Yusko added that any large-scale sale of coins by a major owner may affect the market substantially. According to Yusko, retail traders help in providing the needed liquidity for earlier holders.
These comments were made during the time when the cryptocurrency is trading lower than its May high levels while also being inside the already existing technical zones.
Frequently Asked Questions (FAQs)
What is the current price of Dogecoin?
Dogecoin was trading at around $0.07214, having dropped by 0.14% over the last 24 hours.
What are the key support levels for DOGE?
The key support levels include $0.07136, $0.07028, along with $0.0710 levels, where the buyers have defended it.
Which levels represent key resistances?
The key resistance levels include $0.07226, 200 EMA at $0.07351, 20-day Bollinger midline at $0.07411, and upper Bollinger Band at $0.07793.



