
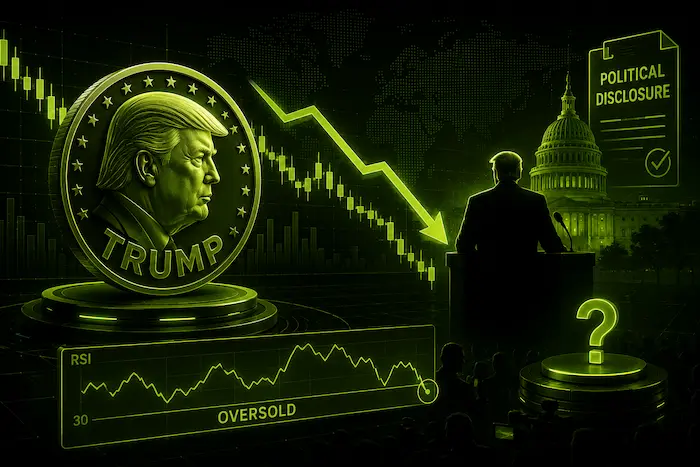
- TRUMP coin sits well above its critical support levels while weekly RSI gets close to being oversold.
- There has been an increase in derivatives volumes, yet open interest has remained relatively low during July.
- According to Nansen, majority of TRUMP’s holders still sit in negative territory after the huge drop since its all-time high.
TRUMP price prediction entered focus on July 5 as the meme token traded at $1.71, reflecting a 9.20% weekly gain while remaining far below its launch valuation. The latest market activity arrived alongside two separate developments.
Technical indicators showed the token approaching its most oversold weekly reading since trading began, while newly released financial disclosures detailed hundreds of millions of dollars in crypto-related earnings connected to President Donald Trump.
At the same time, derivatives data pointed to increased trading activity rather than a broad return of leveraged positioning.
TRUMP Price Prediction Signals Mixed Technical Conditions
The daily chart continues to show TRUMP trading inside a descending channel that has contained price movement since January. SLH formation holds, as the token continues to trade below each of the important exponential moving averages.
Source: Trading View
The 20-day EMA is $1.77, and it lies almost right on top of the current price. There is additional resistance in the form of the 50-day EMA at $1.94, the 100-day EMA at $2.35, and the 200-day EMA at $3.45. Supertrend (10,3) sits at $2.05 and is therefore the first important resistance in case of the continuation of the recent rally.
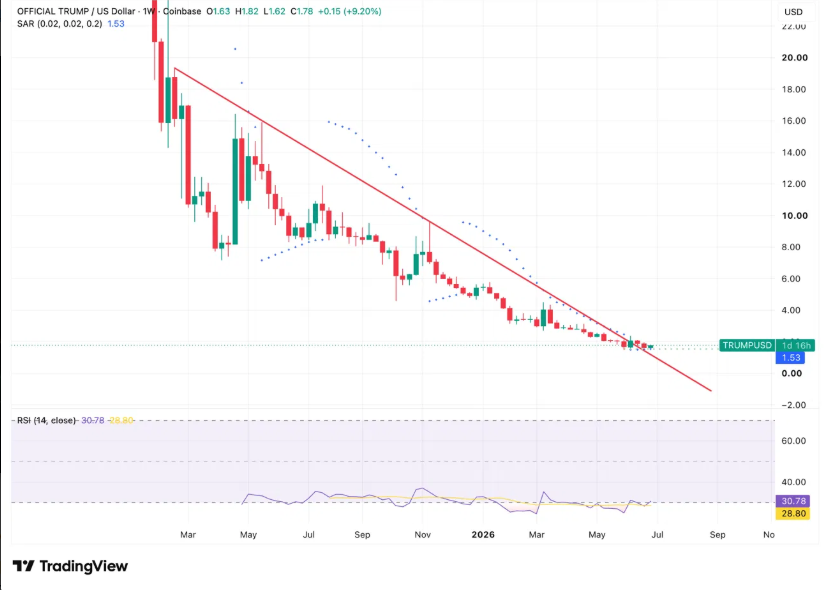
The extended time frame chart shows the overall trend. After touching the prices of around $49 following its listing, TRUMP has fallen by approximately 97%.
Two technical indications have been witnessed lately:
- RSI has moved to 30.78 and now the level is approaching the oversold region for the first time after the start of trading.
- The weekly Parabolic SAR indicator has crossed below the price line at $1.53 and suggests the possibility of momentum reversal if this week’s candle closes above this level.
This technical data has surfaced when the overall trend is below key resistance levels.
Support and Resistance Levels Remain Clearly Defined
Current price behavior highlights several technical levels under analysis.
| Technical Indicator | Price Level | Market Role |
| Weekly Parabolic SAR | $1.53 | Main support level |
| Intraday support | $1.62 | Near-term support |
| 50-day EMA | $1.94 | The first resistance |
| Supertrend (10,3) | $2.05 | Key resistance |
| 100-day EMA | $2.35 | Higher resistance |
The most important support level at the moment is the weekly SAR at $1.53.Above the market, price would need to move through the 50-day EMA before testing the Supertrend resistance near $2.05.
Technical Highlights
- Price remains below all major moving averages.
- Weekly RSI is near its lowest reading since launch.
- Weekly SAR has shifted below price after months of decline.
Derivatives Activity Shows Higher Trading Volume
Derivatives markets have seen an increased level of trading activity in the last trading session.
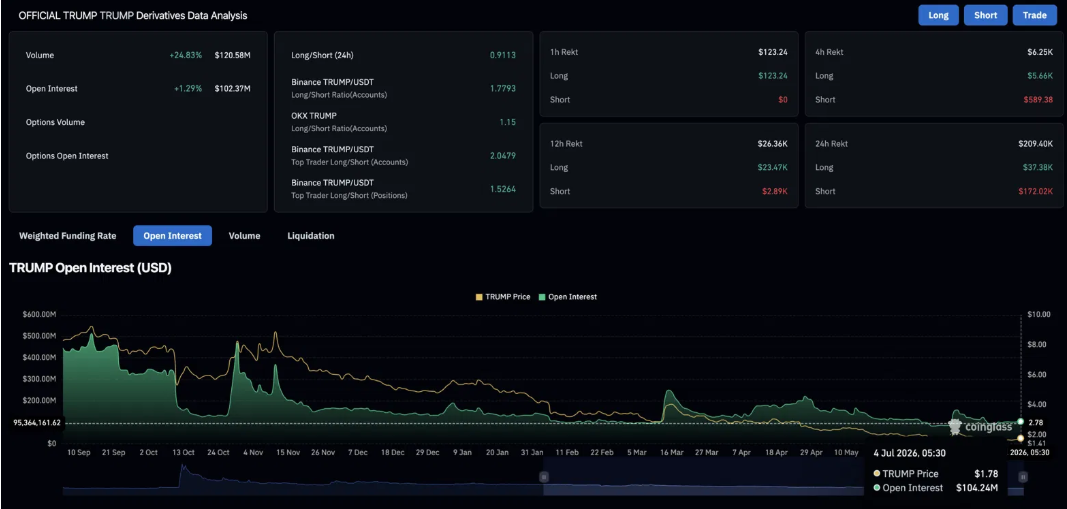
The trading volume has been growing by 24.83%, reaching $120.58 million. Meanwhile, the open interest has been growing by 1.29%, reaching $102.37 million.
Source: Coinglass
Lower growth rate of the open interest compared with the trading volume means that there was an additional level of market participation without growing leverage positions.
The long-to-short ratio equaled 0.9113, which meant that there were more short than long positions among all tracked accounts.
Also, the statistics on liquidation have shown some changes.
During the last 24 hours:
- Total liquidation was equal to $209,400.
- Short liquidation was $172,020.
- Long liquidation was $37,380.
This statistic has shown that those who held bearish positions suffered higher liquidations as the token recovered after recent losses.
Moreover, it should be noted that the open interest has dropped significantly from $500 million or even higher levels registered in late 2025 to over $100 million.
Financial Disclosure Adds New Fundamental Context
The latest mandatory financial disclosure filed by President Donald Trump introduced another development affecting attention around the token.
The 927-page filing reported more than $635 million in royalties generated through Celebration Coins, the entity believed to be associated with the TRUMP meme coin. It also disclosed more than $515 million in revenue from World Liberty Financial token sales.
Combined crypto-related earnings exceeded $1.4 billion, while the filing reported at least $2.2 billion in total disclosed income.
During a CNBC interview, Trump stated that the activities were legal and said that presidents and vice presidents are not subject to federal conflict-of-interest laws. He also stated that his children face unavoidable scrutiny because presidential policy affects nearly every part of the economy. The White House separately denied any conflicts of interest.
The disclosures arrived while the token continued trading roughly 90% below the price levels where much of the reported royalty generation occurred.
On-Chain Data Shows Most Holders Remain Underwater
Blockchain analytics firm Nansen reported that nearly one million buyers of the Official Trump token remain at a loss.
According to the firm’s data:
- Approximately 1.48 million wallets purchased the token.
- About 988,905 wallets are currently holding unrealized or realized losses.
- Combined losses total roughly $3.81 billion.
- Almost 500,000 wallets had almost four billion dollars in realized profits.
The data indicated that the bulk of realized profits was made by those who joined earlier, after the creation of the token.
TRUMP launched on January 17, 2025, three days before President Donald Trump’s second inauguration. The token climbed from below $1 to an all-time high of $73.43 within two days, briefly pushing its market capitalization close to $15 billion before subsequently retracing.
TRUMP Price Prediction Outlook for July
Current technical levels place $1.53 as the primary support area while resistance begins near $1.94 and extends to the $2ithout significant historical support until lower price levels near $1.00. 05 Supertrend level.
If price remains above the weekly SAR and moves through nearby resistance, attention would shift toward the 100-day EMA at $2.35. Alternatively, a move below $1.53 would leave the market w
FAQs
What is the current TRUMP price?
As of July 5, TRUMP trades at $1.71 and shows an increase of 9.20% over the past week according to the presented market statistics.
Which are the main levels of support and resistance for TRUMP?
Support levels include $1.62 and weekly Parabolic SAR at $1.53. Resistance levels are seen at the 50-day EMA of $1.94, Supertrend at $2.05, and 100-day EMA of $2.35.
Why is weekly RSI interesting?
Weekly Relative Strength Index (RSI) is equal to 30.78 and is close to being oversold. It is the lowest weekly RSI value since the token was launched.



