Key Insights
- Tezos Price is still trading close to cycle lows as analysts watch an important accumulation area between $0.16 and $0.20.
- A decisive break above $0.6418 would be enough to favour long-term recovery and change market structure bullish.
- The short-term picture reveals selling pressure is disappearing although upside potential is capped by resistance at $0.25.
Tezos (XTZ) is still languishing near a multi-year low, and traders are contemplating whether the digital currency is about to establish a significant floor. The XTZ is currently trading near $0.234 according to current data.
Tezos Price Approaches Key Accumulation Area
The price of Tezos has been in a long downtrend ever since its ATH around $9.17 hit in 2021. Currently, the asset is moving within a multi-year falling channel, charting lower highs and lower lows one after another.
Crypto analyst Crypto Patel recently took to X, sharing a long-term prognosis on XTZ. The analyst observed a previous bearish breakout that was predicted on the higher timeframes, was playing out exactly as anticipated.
As per the tweet, Tezos saw nearly a 50% fall from the short entry area highlighted on the chart post the bearish structure becoming evident.
Patel is currently eyeing a high risk accumulation area ranging between $0.20 to $0.16, arguing this would attract long term buyers who are looking for value in a time of a prolonged bear run.
As the chart indicates that XTZ might be close to a big cyclical bottom, the analyst stressed on the importance of patience while the market looks for a turning point.
Long-Term Targets Remain in Focus
The analyst maintained several upside targets despite the ongoing weakness.
Key levels include:
- $0.64
- $1.30
- $4.00
- $5.00 and above
A separate projection on the chart extends toward the previous all-time high of $9.1710 over the coming years.
The forecast outlines a gradual recovery process rather than a rapid rebound. Under that scenario, price consolidation would occur before larger advances emerge.
Resistance Levels Continue to Define Market Structure
Several resistance zones remain important for the Tezos price as market participants evaluate trend strength.
| Level | Description |
| $0.4464 | First major resistance |
| $0.6418 | Long-term trend pivot |
| $1.3073 | Major breakout level |
| $3.9868 | Historical resistance zone |
| $9.1710 | Previous all-time high |
The 0.6418 region continues to be one of the most important levels for watch. A push and break above the region will strengthen the recovery story in the long-run. Otherwise, overall bearish bias continues to persist.
The accumulation region of 0.165-0.210 also stays as an important zone for watch. The chart above looks weak with a break below this region.
Projected Recovery Timeline
The chart divides the recovery path into several stages:
Expected Phases
- Bottom formation during 2026 and 2027
- Recovery toward major resistance levels from 2027 to 2029
- Stronger expansion phase between 2029 and 2031
- Potential retest of historical highs by 2034
The projected path remains dependent on broader cryptocurrency market conditions and future investor demand.
Short-Term Indicators Show Early Signs of Stabilization
It’s difficult to make a confident long term judgment however the short term suggests selling pressure could be taking a rest. Four hourly shows XTZ is hovering around $0.2314 after dropping around 42% from highs of around $0.40 in May.
Price action is consolidating around the $0.23 zone with volatility contracting over recent trading sessions.
The Relative Strength Index sits around 40.40 and still remains beneath the 50 neutral level however it is recovering from the extremely oversold position from earlier this month
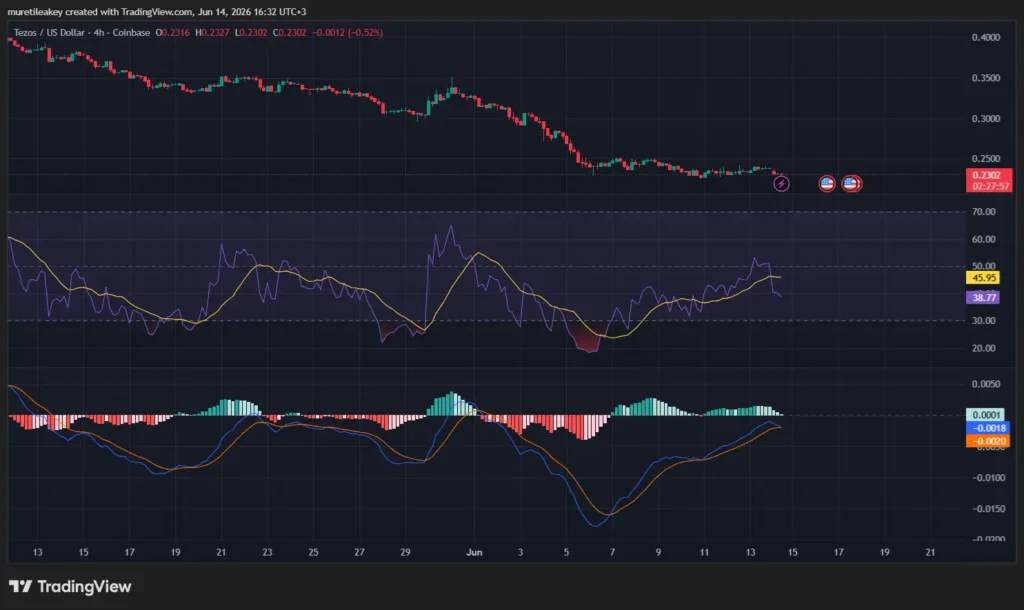
Source; Tradingview
MACD Crossover Draws Attention
Momentum indicators have shown modest improvement.
Current readings include:
- MACD Line: -0.0017
- Signal Line: -0.0020
- Histogram: +0.0002
This bullish crossover could signal that selling momentum is fading. Traders are now waiting to see if the $0.24 – $0.25 resistance zone holds firm before believing that this represents a real push to higher levels.
The price of Tezos is trading on crucial support levels for now, and traders are waiting to see if the bulls can hold ground in the current areas and manage to gain upward momentum to face the higher resistance areas.
The price of Tezos is also dependent on the overall crypto market, while the price of Tezos is still hovering near levels that many investors believe represent long-term value.
FAQs
- What is the key support zone for Tezos Price?
The key support zone is between $0.16 and $0.20. - What is the next major resistance for Tezos Price?
The next major resistance is around $0.4464. - Is Tezos Price showing recovery signs?
Yes, momentum indicators suggest selling pressure is weakening.