

- Zcash Price Prediction saw a rally of 12.1%, while the buyers have been in control of an uptrend as ZEC held above key support levels.
- The open interest increased to above $1 billion, and the short positions were reduced by $13.48 million.
- ZEC traded above all important EMAs, and $600 was the next important resistance level.
Zcash Price continues to be under the radar due to the recent rise of ZEC above the $570 barrier driven by increased trading volume, growth of derivatives involvement, and breakouts above various technical resistance levels.
The price of the asset jumped 12.1% to trade near $570.57 during the past 24 hours. In addition, the trading volume increased by 64.75% to reach $716.79 million. Also, the market capitalization went up to $9.57 billion.
Zcash Price Forecast Backed by Breakout Above Technical Resistance Levels
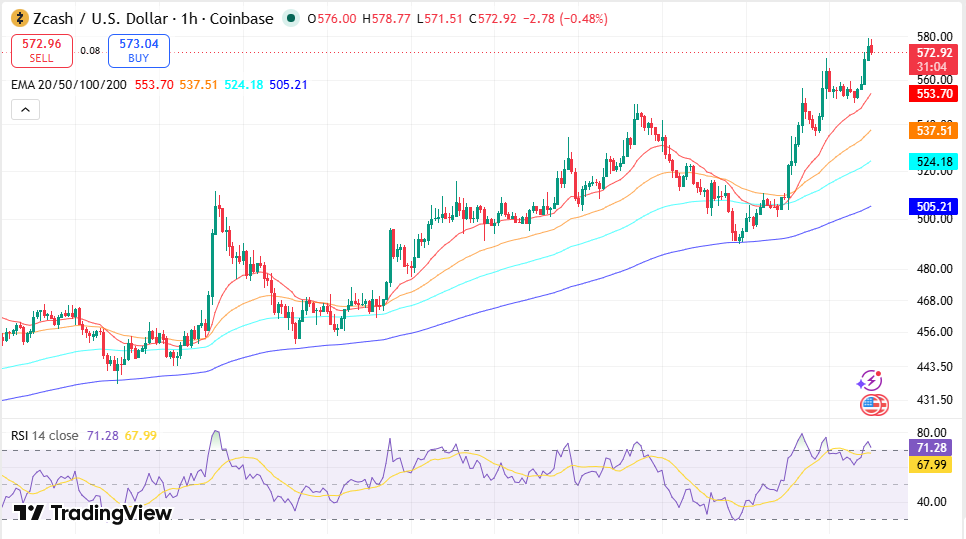
The recent price movement demonstrates that ZEC is now staying above previous resistance of $549.12 after breaking multiple overhead barriers on the one-hour time frame.
Trading at $572.29, ZEC held above the breakout region easily without disrupting its bullish setup in the short term. In case of increased selling pressure, another level of support at $489.75 can be seen below the present market.
Another notable technical development came after ZEC moved above the 0.618 Fibonacci retracement level at $495.84. This level has now been transformed to an extra support region owing to the breakout.
Price needs to be trading above the support level at $549 for the ongoing market pattern to be valid according to the chart details available.
Moving Averages Support the Uptrend
There are further confirmations to the overall technical situation in terms of the positions of the moving averages.
Currently, the 20-day EMA is at $485.71 while the 50-day EMA is at $470.96. The longer moving averages are much lower with 100-day EMA at $445.86 and 200-day EMA at $396.38.
Source: Trading View
Trades above all the three moving averages demonstrate that the coin continues to exhibit strength on various time frames.
At the same time, the pattern of higher highs and higher lows that is observable on the chart confirms the trend following the most recent breakout.
On the other hand, momentum indicators reveal that the Stochastic RSI has moved above the level of 80.
Though the latter demonstrates strong upward momentum, at the same time it implies an overbought condition for the indicator, implying possible consolidation prior to the new movement.
Derivatives Trading Is an Indicator of Growing Market Participation
As the prices of spots were rising further, the derivatives market offered another story about positioning of traders.
The long-to-short ratio on Binance was at 0.5131, while on OKX – 0.33, implying that short position remained dominant on both exchanges.
However, the information on liquidations pointed out that bears had taken the lion’s share of recent forced liquidations. In the last 24 hours, short liquidations amounted to around $13.48 million, while long liquidations were at $467,460.
This imbalance is attributed to the influence of the sharp rise in the ZEC position. Positions that were in bearish positions exited the market.
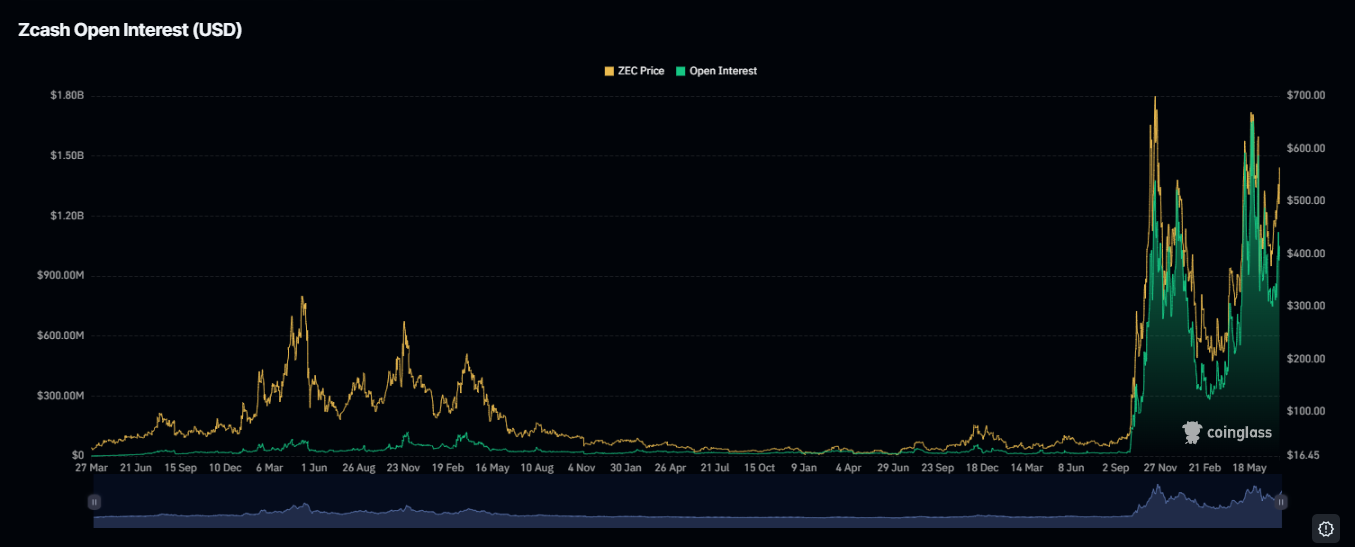
Open interest was also rising with the market. Recent figures revealed that open interest had risen above $1 billion to reach about $1.05 billion when ZEC was trading near its recent high points.
Source: Coinglass
An increase in price and open interest at the same time means that more positions were taken into the market in relation to the rising price. Increased leverage can lead to greater exposure in case of increased volatility.
Exchange Flows Continue Showing Net Withdrawals
Exchange movements also served as yet another sign from the markets during the recent rally.
The numbers reveal that net outflows from exchanges reached roughly $7.57 million when ZEC was trading at about $550.77.
Future changes in exchange balances remain an important indicator to monitor because renewed inflows could coincide with increased selling activity, while continued withdrawals would maintain the existing trend in available exchange supply.
Zcash Technical Levels at a Glance
| Indicator | Level | Market Signal |
| Current Price | $570.57 | Trading above recent breakout zone |
| Immediate Support | $549.12 | Former resistance turned support |
| Secondary Support | $495.84 | 0.618 Fibonacci support |
| Strong Support | $489.75 | Key technical support |
| 20-Day EMA | $485.71 | Short-term trend support |
| 50-Day EMA | $470.96 | Medium-term trend support |
| 100-Day EMA | $445.86 | Long-term support |
| 200-Day EMA | $396.38 | Primary long-term support |
| First Resistance Zone | $561.91–$564.87 | Recently cleared resistance |
| Psychological Resistance | $600 | Next major level |
| Fibonacci Target | $646.07 | Next upside objective |
Factors Supporting the Current Trend
Technical Structure Remains Positive
- ZEC continues trading above the 20-day, 50-day, 100-day, and 200-day exponential moving averages.
- The breakout above $549.12 converted a previous resistance level into immediate support.
- Price continues forming higher highs and higher lows on the one-hour chart.
Derivatives Activity Shows Growing Participation
- Open interest has increased to approximately $1.05 billion.
- Short liquidations reached $13.48 million during the past 24 hours.
- Open interest rising in conjunction with prices is an indicator of more participation in the markets.
Exchange Flow Remains on Course for Fewer Sellers
- The net flow out of the exchanges was around $7.57 million.
- Smaller amounts in exchange reserves mean less supply of sellers readily available.
- Future flows into the exchanges might be indicative of profit taking.
Price Levels to Look Out For
The current technical levels are well-defined after the recent breakout.
Resistance on the upside lies in the range of $561.91 and $564.87. Even though ZEC has broken out from this level, sustaining prices above these levels will be conducive to the current trend.
The next technical level above this area will be the psychologically important $600 figure, and then the Fibonacci extension objective of $646.07.
Support on the downside is found at $549.12, with another support level at the Fibonacci retracement support level at $495.84. Further technical support exists at the 20-day exponential moving average (EMA) level at $485.71, and the 50-day EMA at $470.96. With further selling pressure, prices may retest the 100-day EMA level at $445.86, and Fibonacci support level at $403.02.
Frequently Asked Questions (FAQs)
Why is the most recent price prediction for Zcash viewed as bullish?
ZEC remains above all major exponential moving averages, has broken above several resistance levels, and continues to trade above the key support zone at $549.12 while open interest has exceeded $1 billion.
Why is the $549.12 level important?
$549.12 was a resistance point prior to the break out in price and it is now the closest technical support.
What is the implication of increasing open interest on ZEC?
Increasing open interest to about $1.05 billion means that new positions are being created in the derivatives market while there are price increases.