
- The cryptocoin XRP is trading below all four major 4-hour exponential moving averages at the level of $1.10.
- Open interest has dropped to the level of $2.53 billion.
- Support stands at the level of $1.1070, whereas resistance stands at $1.1448.
The forecast of the XRP price is still focusing on the XRP ability to hold critical levels of support after the XRP price fell below some technical levels.
In the recent trading session, the XRP price stood at $1.11, having dropped from the intra-day high of $1.134 as well as from the derivatives and spot markets, showing the lower interest of traders.
XRP on the 4-hour chart was trading below several exponential moving averages (EMA), where technical momentum showed weak demand.
XRP Price Forecast: XRP Trading Below Some Technical Levels
The XRP price is at $1.11, which has declined by 2.07%. During the session, the token dropped sharply from around $1.134 before finding support near the $1.10–$1.11 range. Although the price briefly recovered above $1.12, that move was not maintained as selling pressure returned.
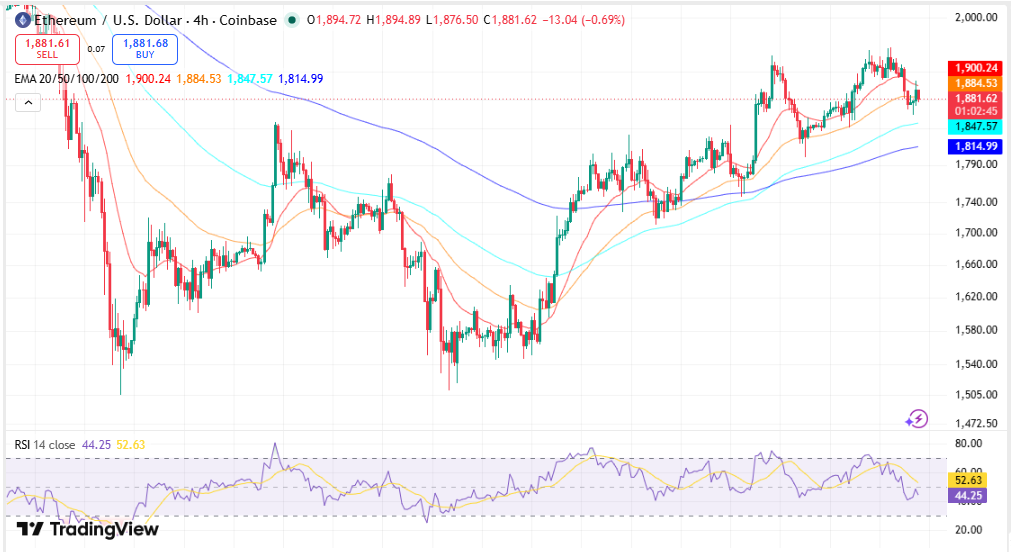
The 4-hour TradingView chart showed XRP changing hands at $1.1085, down 0.43% during the session. The token was trading below the 20 EMA at $1.1204, the 50 EMA at $1.1146, the 100 EMA at $1.1094, and the 200 EMA at $1.1197.
Source: Trading View
The movement in the prices showed that XRP was rejecting the 200 EMA and then falling towards the $1.10 area, which was serving as the immediate support. Staying below all four moving averages was in line with the current short-term trend.
XRP Price Forecast Emphasizes Fibonacci and RSI Levels
Various Technical Indicators Showed Various Price Levels Which May Have an Effect on the Trading Activity in the Short Run.
In the Fibonacci retracement, the near-term support is set at the 0.236 retracement level of $1.1055. For any retracement that may occur above the current price level, resistance levels have been noticed at 0.382 ($1.1194), 0.5 ($1.1307), 0.618 ($1.14 However, the 1.618 Fibonacci extension at $1.2373 was the longer-term upside level that was visible in the chart.
Other technical analysis tools were also showing weaker market strength. For instance, the Relative Strength Index (RSI) was measured at 44.03 with its signal line being at 51.87. The RSI being below not only the neutral 50 level but also the signal line signified the absence of upward momentum during the entire period. Moreover, the support and resistance indicator suggested $1.0823
Derivatives Activity Declines as Open Interest Stabilizes
The derivatives market data also showed lower levels of speculative positions in comparison to past periods.
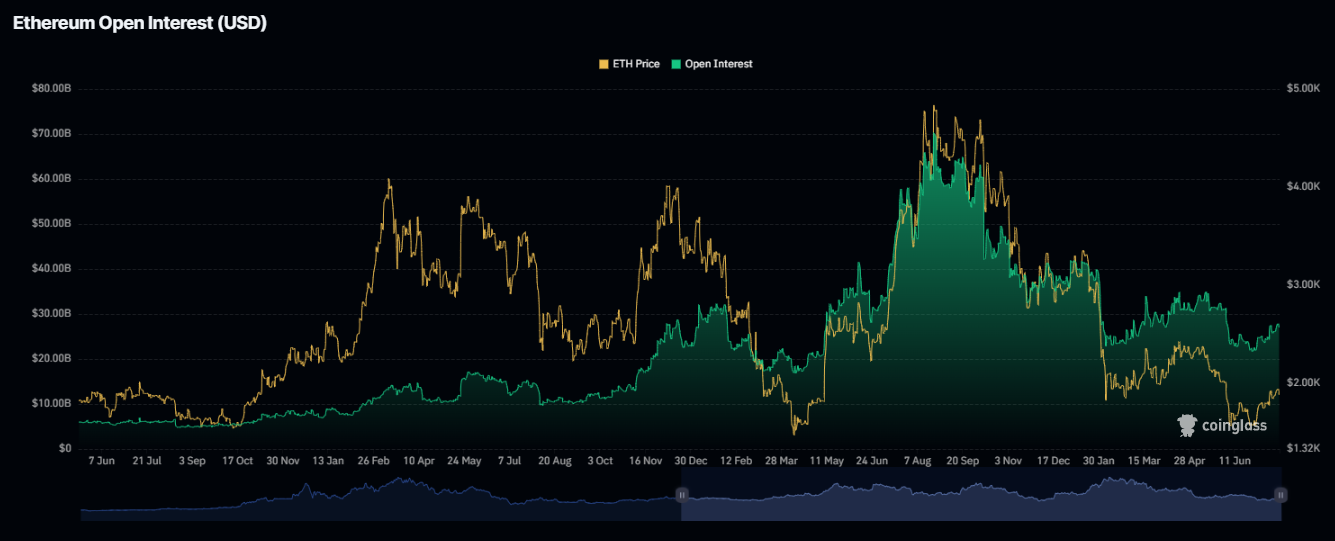
Open interest, which was above $10 billion during the previous rally, dropped to $2.53 billion as of July 23. This lower level showed that the leverage had decreased due to the range-bound trading of XRP.
Source: Coinglass
As of press time, open interest was observed to stabilize at the $2.5 billion level. The market participants can continue following the change in this level, which usually accompanies price fluctuations.
The decrease in the open interest was associated with the failure of XRP to hold higher price levels following its recovery attempts, which has resulted in lower derivatives positions compared to the previous highs.
Outflows Remain Dominant in Spot Market
Spot markets also continued to indicate net outflows.
The data available from CoinGlass indicated that there had been several occasions during the period under consideration where outflows have been greater than inflows. Outflows were significantly higher on several occasions, indicating ongoing withdrawals and selling activities.
The latest reading indicates a net outflow of around $3.37 million on July 23. Although there had been instances of inflows as well, they were not sufficient enough to reverse the existing spot flow trends. These factors coincided with the decline in XRP below several critical technical levels.
XRP Technical Overview
| Technical Level | Current Value | Trend Indicator |
| XRP Price | $1.11 | Hovers around support zone |
| RSI (4H) | 44.03 | Stays below neutral level |
| Open Interest | $2.53B | Leveraged positions remain reduced |
| Resistance | $1.1448 | First resistance level |
| Support | $1.1070 | Below support zone |
Critical XRP Levels Under Spotlight
Recent price movements have put a number of technical levels under watch.
On the upside, initial resistance comes in at $1.1448 and $1.1642. A move beyond those levels would place $1.2318 and $1.2950 as the next chart-based resistance areas.
On the downside, initial support is positioned at $1.1144 and $1.1070. Additional support is identified at $1.0757, while $1.0088 remains the major swing low shown on the chart.
A separate longer-term resistance level remains at $1.4344, identified as the 200-day EMA. That level represents the highest technical resistance referenced in the available data.
Technical Reasons for the Current View on XRP
- XRP is trading below its 20, 50, 100, and 200 EMAs in the 4-hour chart, pointing out that the ongoing trend has not been broken yet.
- The Fibonacci retracement shows the first level of resistance at $1.1194 and $1.1784 and $1.1055 continues to be the immediate support level.
- There are continued outflows from the spot markets but open interest stays substantially lower than previous highs.
Levels Traders Continue to Monitor
- Resistance levels are located at $1.1448, $1.1642, $1.2318, and $1.2950.
- Support remains at $1.1144, $1.1070, $1.0757, and $1.0088.
- The $1.4344 200-day EMA remains the major longer-term resistance level identified on the chart.
FAQs
What is the current XRP price?
XRP was trading near $1.11, representing a 2.07% decline over the previous 24 hours at the time of analysis.
Why is the XRP below the moving averages?
According to the 4-hour chart, XRP has been trading below the 20, 50, 100, and 200 EMAs as it could not hold a recovery move recently.
What does the RSI reveal about XRP?
The current RSI level is 44.03 and has gone below the signal line level of 51.87.



