

- The price of ENA moves above $0.10 and the bullish pattern focuses strongly on the resistance level of $0.15 for buyers.
- Momentum of ENA is solid although an RSI greater than 90 suggests a possibility of profit-taking and consolidation.
- USDe holds at $1.00 and its trading activity draws focus towards the market model of Ethena.
Ethena (ENA) has moved into a sharply bullish technical structure after breaking above the $0.10 psychological resistance and a descending trendline that had contained its price for months.
Recently, the price ranged between $0.1386 and $0.143, rising by almost 40% in value despite being indicated strongly by technical analysis tools. With this development, the resistance point stands at $0.145, with $0.15 becoming the next critical level.
ENA Has Broken Resistance
ENA has spent months trading below a descending trend line due to failed recovery attempts.The token later compressed between approximately $0.08 and $0.10, forming a base beneath the broader downtrend.
The latest advance changed that structure as ENA moved above the descending trendline and reclaimed the $0.10 level. The breakout was accompanied by an increase of nearly 40%, taking the token toward $0.14.
The move above $0.10 represents a key technical change in the price structure. The retest of the $0.10 to $0.11 area would give further confirmation of the breakout, whereas the failure to hold onto it would undermine the existing structure.
The nearest resistance is located close to the $0.145 area. The penetration of that area will shift attention towards the $0.15 area, then to the $0.18 and $0.20 levels provided that the higher levels are captured.
Strong Momentum Revealed by Technical Indicators
The four-hour ENA/USD chart reveals the bullish configuration of the major exponential moving averages. The 20 EMA stands at $0.10391, while the 50 EMA is at $0.09419. The 100 EMA is positioned at $0.09060 and the 200 EMA at $0.08821.
The price remains substantially above all four averages. This arrangement confirms the strength of the current trend but also shows how far the token has moved from its short-term averages.
The Bollinger Band structure provides another indication of the intensity of the rally. The current price of ENA shares is above the upper Bollinger Band level. Such positioning also leaves the token exposed to a pullback or consolidation following the rapid advance.
The RSI is reported at 93.61, while its moving average is around 75.84. The reading places momentum firmly in overbought territory. Buyers remain dominant according to the indicator, although the level also highlights the possibility of near-term profit-taking.
Key ENA Support Levels Remain in Focus
Several support zones could determine whether the breakout develops into a sustained recovery. Technical support can be found in the price levels of $0.1315 and $0.1200 according to the four-hour charts.
In addition, other technical support can be found at $0.1250, and further technical support can be seen at the 20 EMA of $0.10391 and 50 EMA of $0.09419. More support levels include $
Any defense of the $0.10 – $011 area will maintain the breakout pattern. On the other hand, any failure at $0.15 and then a drop below $0.10 would mean that the token was unable to establish sustainable support above the former resistance area.
Arthur Hayes Lays out 5X to 10X Thesis
Arthur Hayes has laid out a 5X to 10X upside case scenario for ENA in favorable market conditions. The thesis is based on BTC strength and rising crypto basis returns and not on a token price prediction.
Ethena’s USDe ecosystem employs a delta-neutral strategy which seeks to earn returns on crypto-native markets. This means that the economics of USDe depend on derivative trading and funding or basis conditions.
USDe has been trading around $1.00, while its 24-hour trading volume is reported to be $41.25 million.
Stronger crypto prices combined with favorable basis yields could improve conditions for the model, while weaker derivatives conditions or reduced USDe demand could provide less economic support.
ENA Faces a Critical Breakout Test
The next stages of the move center on whether ENA can maintain prices above the former $0.10 resistance and advance beyond $0.145. A sustained daily close above $0.15, alongside continued volume and broader crypto-market strength, would place $0.18 and $0.20 among the levels being monitored.
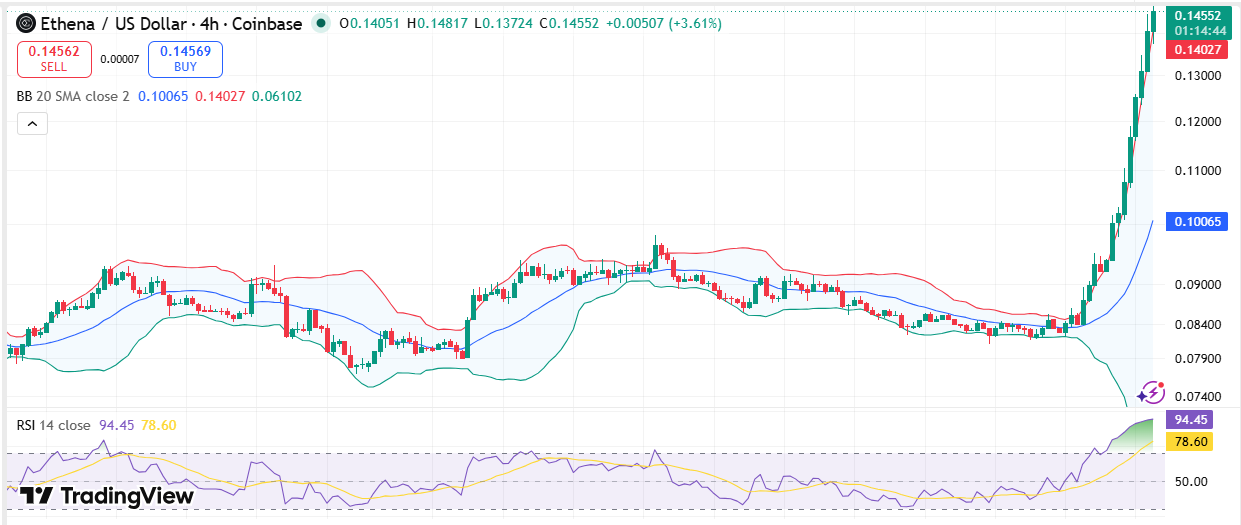
Source: Trading View
However, the current RSI and Bollinger Band readings show that the rally has moved rapidly. Profit-taking could therefore produce consolidation before another breakout attempt.
FAQs
What is the immediate ENA resistance level?
The short-term resistance level identified from the analysis is at around $0.1450, and there is yet another resistance level at $0.15.
What are the main ENA support levels?
Key support areas include $0.1315, $0.1250, $0.1200, $0.1039, $0.0942, $0.0916 and $0.0811.
Why is ENA considered technically overextended?
ENA is currently trading above the upper Bollinger and an RSI reading of 93.61,



