

- Cardano is trading around $0.2130, down by 3% over the last 24 hours.
- Cardano price holds above $0.214 while a possible bullish wave 1-2 structure develops.
- A break above $0.241 would open the charted path toward $0.27–$0.28.
Cardano displays a bearish outlook today following the broader market pullback. Macro headwinds, such as an oil shock, are dominating, reviving Fed rate-hike fears ahead of Friday’s inflation data. As a result, overall market capitalization has plunged to $2.65 trillion, while 24-hour trading volume has surged to $83 billion.
At the time of this writing, ADA was trading around $0.2130, down by 3% over the past 24 hours. Despite the latest pullback, the altcoin is up by 4% and 14% on the weekly and monthly charts, respectively. Its market cap and trading volume stand at $7.80 billion and $470 million, respectively.
Cardano Price Holds Above Fibonacci Support
Cardano price is trading around the $0.2100 region after retreating from a resistance band between $0.228 and $0.241. According to a recent market update by crypto analyst More Crypto Online on Sep 10, ADA may have completed five upward waves from its August 31 low. That advance began near $0.188 and may represent wave one of a larger Elliott Wave sequence. Meanwhile, the current decline could form wave two before another upward move develops.
The four-hour chart places Fibonacci support between $0.197 and $0.214. Specifically, retracement levels sit near $0.2146, $0.2096, $0.2046, and $0.1977. Buyers defending this area would preserve the analyst’s direct bullish structure. Therefore, the setup continues to point toward a possible third wave.
https://x.com/Morecryptoonl/status/2097793466646352286?s=20
ADA Approaches the Main Breakout
A rebound would first return ADA toward $0.228, where sellers stopped the latest rally. Next, bulls would need a decisive move through $0.241 to strengthen the wave-three outlook. Such a break could open a path toward $0.27 and $0.28. Moreover, the chart maps later projections near $0.31 and $0.32 if the broader sequence develops.
However, a move under $0.197 would favor a wider corrective phase. Under that scenario, the chart identifies support across the $0.157 to $0.188 region. Additional Fibonacci markers stand at $0.1887, $0.1753, and $0.1579. Notably, the analyst treats $0.189 as the invalidation level for the smaller bullish wave count.
For now, Cardano sits above its immediate support range while traders track the next reaction. A sustained defense could keep the bullish structure intact. However, the resistance band provides the clearest confirmation point for the projected advance.
Cardano Faces Volatility as US PPI Inflation Takes Focus
The crypto market is bracing for a busy inflation calendar, with August’s US PPI inflation report due today at 8:30 a.m. ET. Economists forecast annual producer inflation at 5.3%, up from July’s 4.7% reading. The report measures changes in prices received by domestic producers for their output.
A reading above 5.3% could pressure crypto prices and wider risk markets by strengthening expectations for higher interest rates. A result below forecast could ease those concerns and support demand for cryptocurrencies and equities.
https://x.com/cryptorover/status/2097955968734675431?s=20
An outcome matching 5.3% may produce mixed trading as investors examine the report’s underlying components. Price action could turn uneven while markets reassess the Federal Reserve’s next policy decision.
Meanwhile, Friday’s US CPI report follows at 8:30 a.m. ET, keeping inflation firmly at the center of market attention. Together, both releases may guide rate expectations and shape Cardano price volatility across the next two sessions. Liquidity may thin around publication, increasing short-term price swings across trading venues.
Coinbase CEO Suggests Two Paths Could Define New US Crypto Rules
Coinbase’s Brian Armstrong noted today that he expects clearer United States crypto rules following a September 15 Senate procedural vote on the CLARITY Act. The measure seeks to define federal oversight of digital assets and market participants.
Armstrong says regulatory work could continue even if senators block the bill. The SEC and CFTC remain prepared to develop separate rules. Therefore, either route could influence the broader US crypto market and Cardano price action overall.
Cardano Technical Analysis: ADA Tests Support at $0.2120
Looking at the technical indicators on the daily chart, ADA is heading toward the support around $0.2120. The recent upward momentum faced resistance at the $0.2320 region, leading to a price correction. Should the current trend hold further, ADA could drop below the current support, heading to the $0.1920 level.
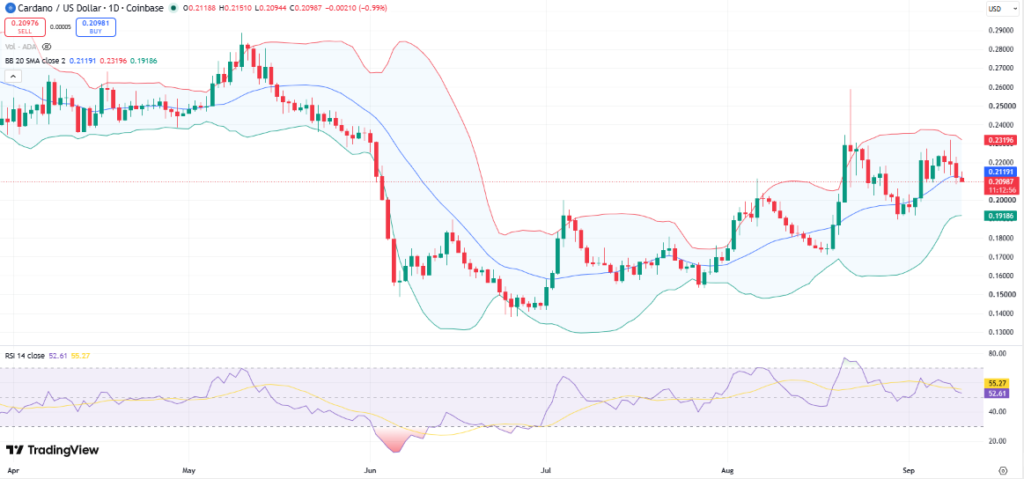
ADA Price Chart: TradingView
Meanwhile, the 14-day Relative Strength Index (RSI) is holding at neutral levels around 54 levels. This suggests that the buyers and sellers are battling for control at the moment. An increase in buying pressure could push the price upwards, while selling pressure could push the price downwards.



