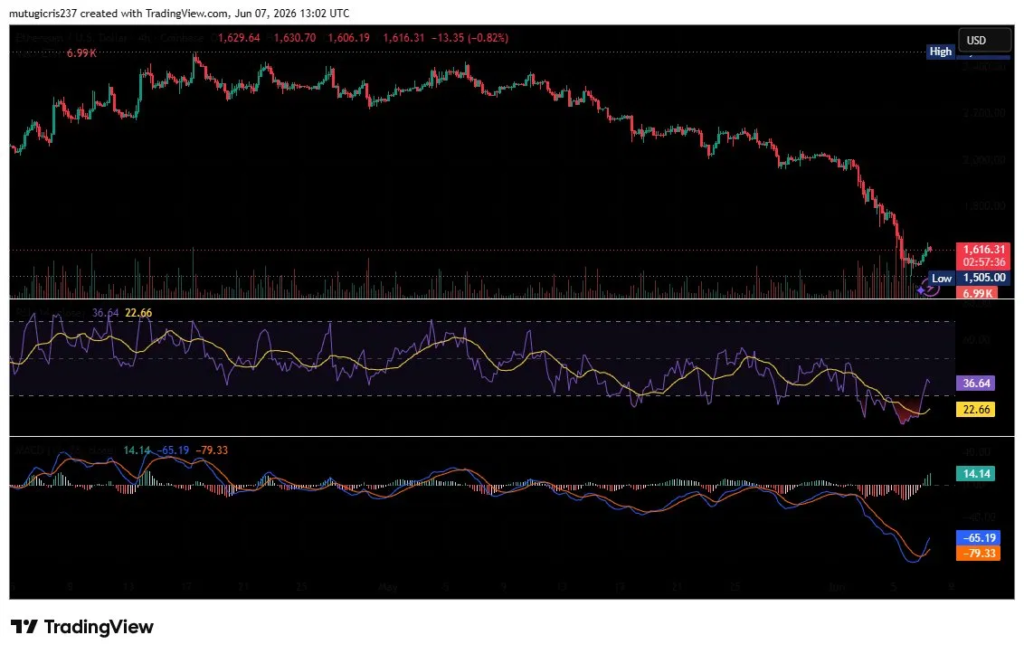
Ethereum is trading at $1,616 on June 7, down 0.82% on the day. The price crashed to a low of $1,505 before large buyers rushed in. Selling pressure is starting to ease, but ETH still needs to push higher before bulls can take charge.
ETH Price Drops Hard But Finds a Floor
Ethereum has been in a clear downtrend since early 2026. The price fell from highs above $2,200 and kept dropping through May and into June. Sellers were in full control for weeks, pushing ETH lower with barely any relief.
That changed when ETH hit $1,505. At that point, large buyers entered the market aggressively. The price bounced and is now holding around $1,616. That $1,505 level is now acting as short-term support. As long as ETH stays above it, the bulls have a base to work from.
Source: Tradingview
ETH is not safe yet. The technicals and on-chain activity, however, are starting to tell an interesting story.
Stochastic RSI Curls Up From Oversold Levels
The Stochastic RSI on the daily chart is one of the clearest signals right now. The indicator reads 36.64 on the main line and 22.66 on the signal line. Both numbers are in deeply oversold territory, and both lines are beginning to curl upward.
The Stochastic RSI at 36.64/22.66 is starting to hook upward from deeply oversold ground. At these readings, sellers are typically exhausted, and even modest fresh buying can spark a sharp move higher. A cross above 50 would strengthen the recovery case considerably.
MACD Still Negative But Histogram Is Narrowing
The MACD paints a more cautious picture. The MACD line sits at 14.14 while the signal line reads -65.19, giving a histogram reading of -79.33. These numbers show that bearish momentum has been very strong over recent weeks.
However, the histogram bars are starting to shrink. This narrowing is an early sign that selling pressure is losing strength. The MACD has not flipped positive yet, meaning bulls cannot fully relax. But the trend within the indicator is moving in the right direction.
For ETH to see a strong recovery, the MACD will need to cross above the signal line. That crossover has not happened yet, so patience is still needed.
James Wynn Flips From Short to Long
One of the most talked-about moves on June 7 came from trader James Wynn. On-chain analytics platform Lookonchain reported that Wynn closed his short positions on Bitcoin and Solana, booking a $6,400 profit. He then opened maximum leverage long positions, putting $373,000 into 6.05 BTC and $8,500 into 5.3 ETH.
https://x.com/lookonchain/status/2063504947120124171
This matters because Wynn had been betting on prices going down. Flipping to max leverage longs at current levels means he now believes the bottom is in or very close. Wynn is a closely watched trader in the crypto space, and his directional shift has drawn attention from the broader market.
Whales Are Buying the Dip
Wynn is not the only one buying. An early Ethereum holder known as an Ethereum OG spent $55.8 million to buy 35,723 ETH at an average price of $1,563. This is the same wallet that sold around $136 million worth of ETH near $2,040 earlier. Buying back at $1,563 suggests the whale views current prices as a strong entry point.
Source: X
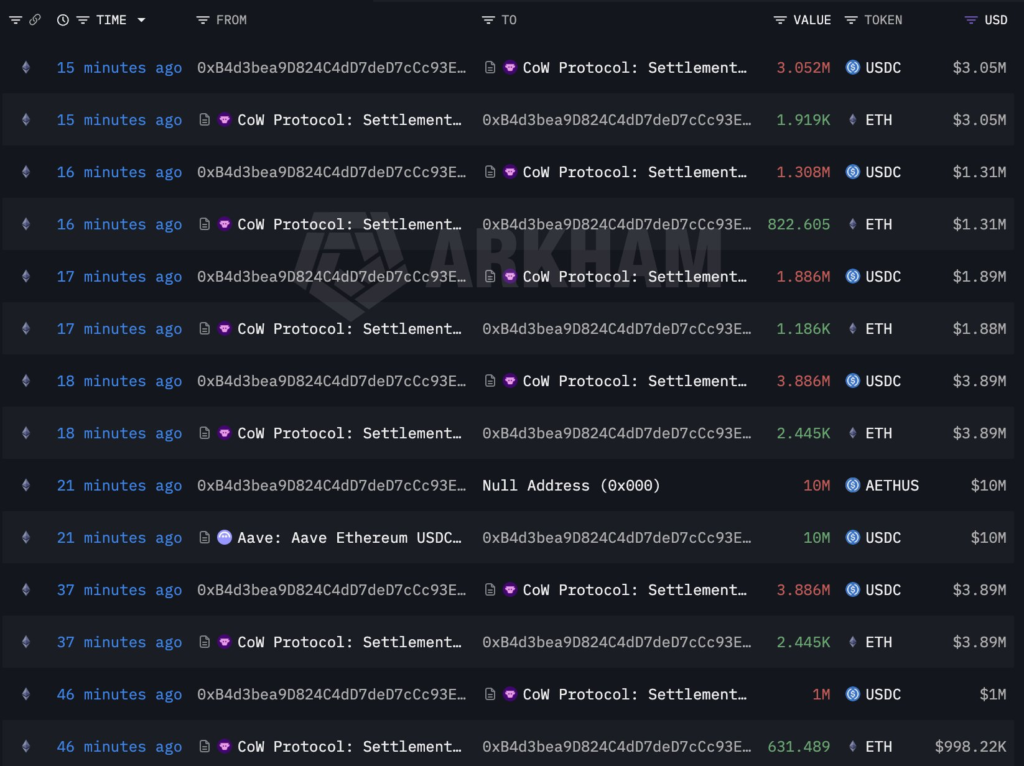
A second large buyer borrowed $142 million in USDT from lending protocol Aave and used it to buy 87,680 ETH at an average price of $1,620. That position is leveraged and faces liquidation if ETH drops to $1,354, so it carries risk. But the sheer size of the buy shows that big money is stepping in at these levels.
What Comes Next for ETH
For Ethereum to confirm a recovery, it needs to break above $1,700. That level has acted as resistance since the price broke down sharply. A clean move above $1,700 would open the door toward $2,000, the next major target.
On the downside, $1,505 is the line in the sand. A drop below that level would signal that sellers are back in control and could push ETH toward $1,400 or lower.
The indicators are flashing early recovery signals, whale buyers are active, and a major trader has flipped long. The next 48 to 72 hours will be key in deciding which direction Ethereum heads next.
FAQs:
Q1: What is Ethereum’s price today?
A1: ETH is trading at $1,616 as of June 7, 2026, down 0.82% on the day.
Q2: What was Ethereum’s recent low?
A2: ETH hit $1,505 before recovering toward current levels.
Q3: What does the Stochastic RSI signal for ETH?
A3: Both lines are rising from oversold levels below 25, suggesting selling momentum is fading.
Q4: Who is James Wynn and why does his trade matter?
A4: James Wynn is a closely watched crypto trader who closed his shorts and opened max leverage longs on ETH and BTC on June 7, 2026.
Disclaimer: This article is for informational and educational purposes only and does not constitute financial, investment, or trading advice. Cryptocurrency markets are highly volatile and involve significant risk. Always conduct your own research and consult a qualified financial advisor before making any investment decisions.