- Solana traded near the lower boundary of a long-term descending channel after months of lower highs and lower lows.
- The four-hour chart placed immediate focus on the $81.20 support level following several failed rebounds above $90.
- A broader support zone between $71.92 and $77.96 aligned with major Fibonacci retracement levels and earlier consolidation ranges.
Solana continued to hold on to the pressure as it spread its overall pulldown on the higher and lower time frame. A significant support area had formed around $81 and sellers were in control of the market structure as it traded around that area. This month, SOL had not been able to maintain upward momentum from the $200 level and was now approaching the bottom of a falling channel.
Worse, shorter time frame charts also showed that the attempts for recovery lost momentum below key resistance once more. The latest market structure placed focus on the support area between $71 and $78, where several Fibonacci retracement levels converged with previous consolidation zones.
Solana Tests Key Monthly Support Zone Amid Descending Channel Pressure
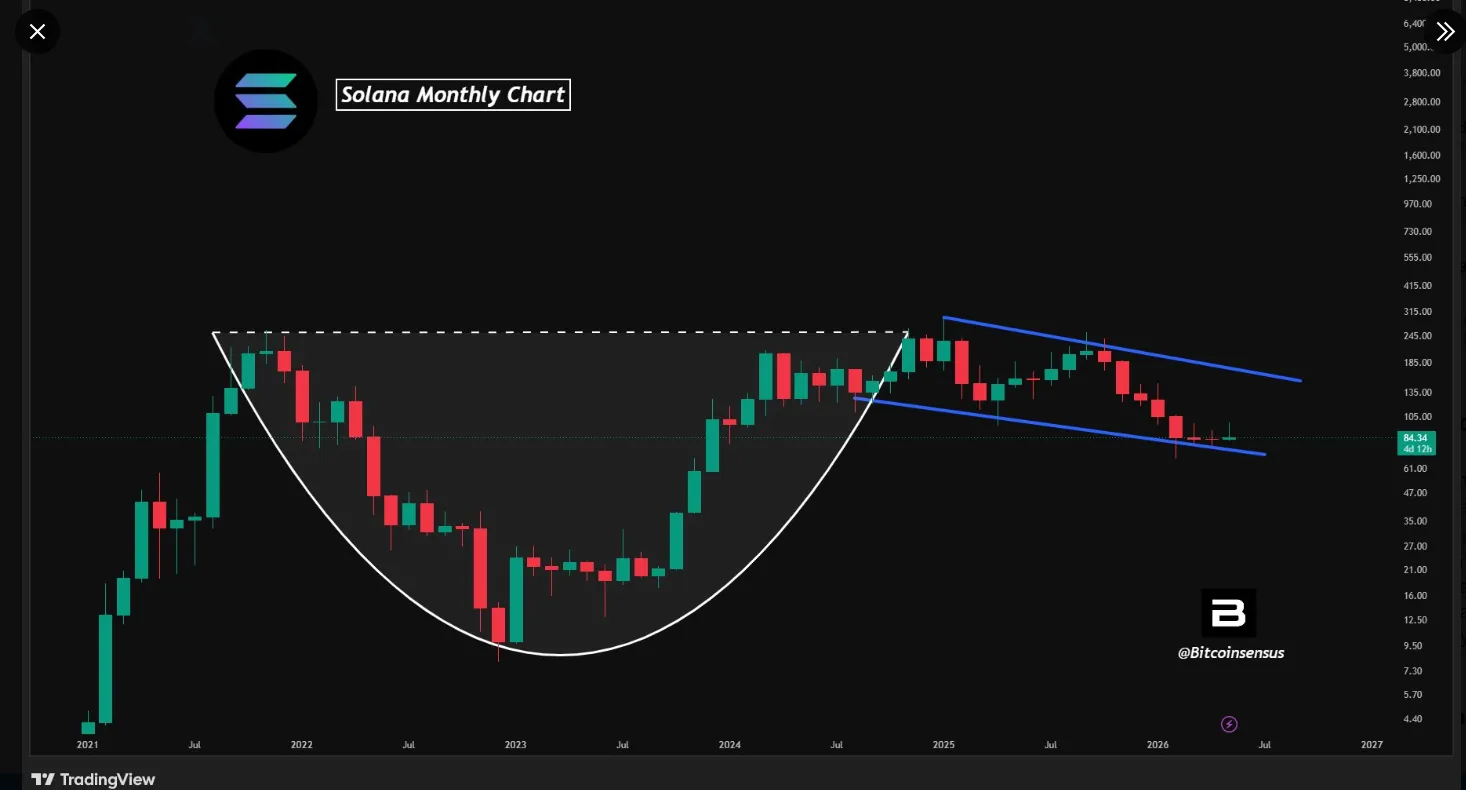
Solana traded near the lower boundary of a descending monthly channel during the period shown in the chart. The structure formed after a major recovery from lows recorded during 2022. Price action moved inside a rounded bottom formation before reaching resistance near the upper range. Purchases drove SOL up over $200 during the recovery period before the trend reversed.
The monthly candles showed a few that closed lower from the rejection at the top resistance area. Sellers got the upper hand when the market did not hold higher highs outside of the breakout area. The new corrective structure was recorded in the last session on the blue channel of the descending channel during the monthly sessions.
SOL kept the trend of lower highs and lower lows down through the downward channel in 2025 and early 2026. The latest candles approached the lower support trendline near the $80 region. Price remained close to that support zone at the time displayed on the chart.
The rounded bottom formation covered nearly two years of market movement before the recovery accelerated. The recovery phase brought SOL from double-digit prices toward the $250 range. Trading volume appeared stronger during the rally period compared to the correction phase.
Solana Holds Near Critical Support as Downtrend Pressure Continues
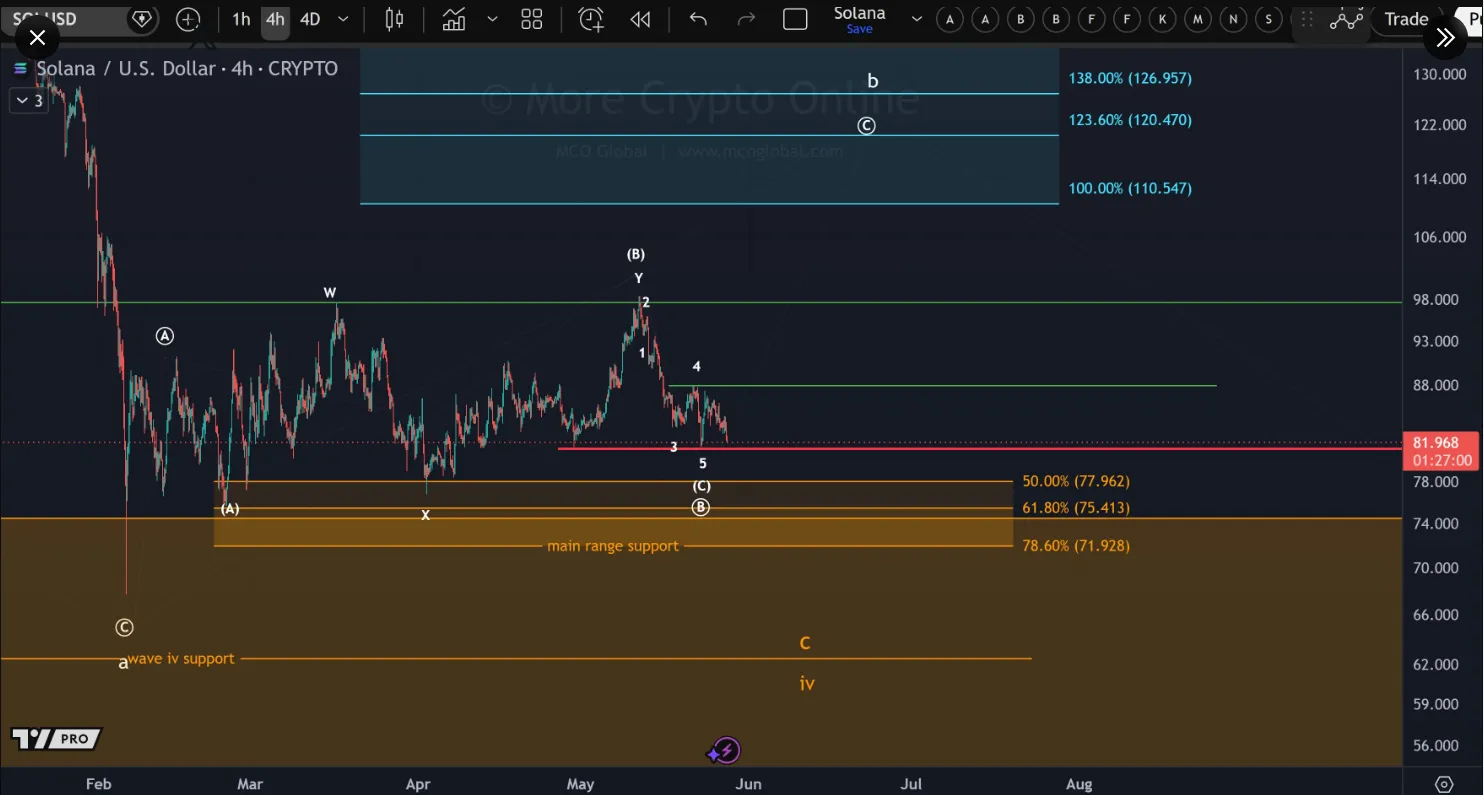
Solana traded near the $81 region on the four-hour timeframe during the period shown on the chart. Price remained below several marked resistance levels after repeated failed recovery attempts during recent sessions. Sellers controlled momentum after SOL declined sharply from the February highs near the $130 range.
The Elliott Wave chart showed several Elliott Wave labels indicating corrective price action going against the larger trend. In March, April and May, SOL continued to trend lower and set new highs. The price closed in the vicinity of the marked support at $81.20 with the latest down move.
An important support zone was found between $71.92 and $77.96 below the current trading range as revealed by the analysis. Inside it were appearing Fibonacci retracement levels, such as 50%, 61.80%, and 78.60%. Those levels were consistent with previous price swing consolidation periods.
During the trading period, Price tried to rebound multiple times over $90, but was unable to keep the momentum going.The market later reversed lower after reaching resistance near the green horizontal levels around $98 and $88.
The chart also marked a broader wave four support region near the lower section of the structure. SOL traded close to breakdown territory as the chart approached the beginning of June.
Market Impact as Solana Weakness Pressures Key Support Levels
Continued weakness in Solana’s price structure increased pressure across the broader altcoin market during the observed period. Traders were keen on the $81 support level, which despite a few attempts, saw short-term bullish momentum die down. The sentiment about Solana-based assets and decentralized finance activity in the network ecosystem was also negatively impacted by lower prices.
The larger support area from $71 to $78 is an important range for buyers to watch for possible continuation to the downside. If it breaks below the current support, it will trigger higher volatility in the other trading pairs and derivatives trades. Additionally, the long correction brought focus to capital protection as traders pulled back as markets grew volatile.
Conclusion
On the monthly chart, Solana was caught in a larger corrective pattern while on the lower time frame chart, it is trading within a smaller corrective pattern. Despite a few attempts to recover, the market has not been able to find a higher resistance level. The bearish momentum was continuing to play out and price action was confined to the lower support line of the descending channel.
The chart formation also highlighted the $71.92 to $77.96 support range. There were a number of technical levels within that range relating to previous market activity and Fibonacci levels. SOL was near breakdown territory and the overall downtrend picture was intact as the month of June began.