

- HYPE fell by 7.17% from important support levels as high volumes and oversold situation made traders pay attention to its further actions.
- Longs had to face $2.83 million in liquidations in spite of open interest being above $2.5 billion.
- The Hyperliquid processed $633 billion of volume in Q1 while its infrastructure continued to assist funded crypto trading programs.
The conversation concerning hyperliquid price forecasts remained current as HYPE continued to decline for the past 24 hours amid selling pressure despite high volume.HYPE was traded at $58.62, having fallen by 7.17% over the period after dropping from above $63.
Notwithstanding that, the 24-hour volume was up 28.23% to $379.23 million, while market cap fell to $14.81 billion. Meanwhile, derivatives analytics kept showing high leverage involvement, while events in terms of crypto trading in proprietary accounts made it clear that Hyperliquid served as an execution layer for funded trading programs running on-chain.
HYPE Predictive Price Analysis Reveals Bearish Trend
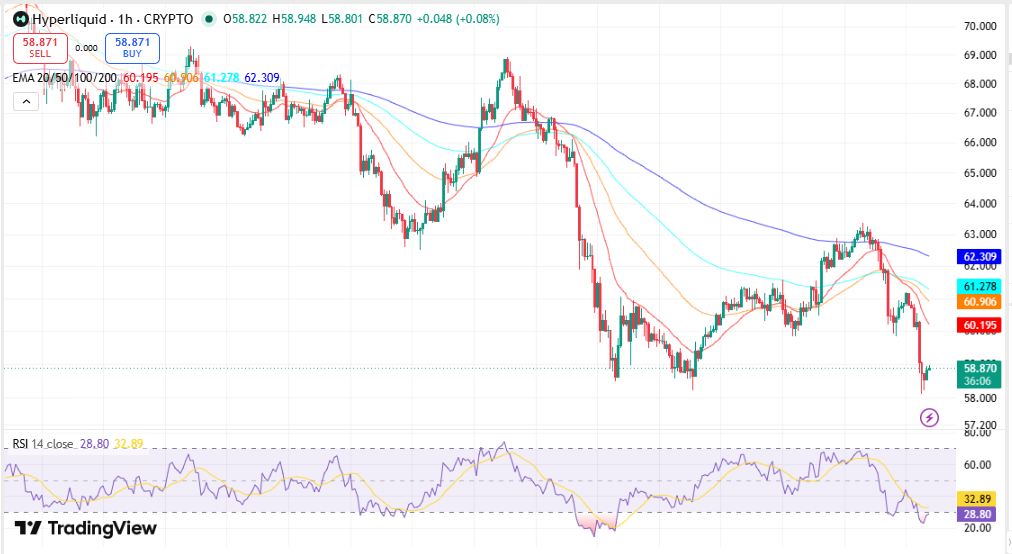
According to the hourly chart, HYPE was facing consistent sell-off during the whole period. After struggling above $61, the coin fell further until it broke below the $59 level and dropped towards $58.25.
From the technical perspective, HYPE had been trading below all major moving averages. Specifically, HYPE traded below the 20-hour exponential moving average at $60.51, 50-hour EMA at $61.09, 100-hour EMA, and 200-hour EMA.
Source: Trading View
The RSI fell to 23.02, taking the coin into the oversold zone. The Stochastic RSI had readings of 0.00 and 13.39 respectively, while the asset was below the lower Bollinger Band indicating extreme volatility amid the downswing.
Key Technical Indicators
- Trend: The trend was bearish since the coin was trading below all the hourly EMA lines.
- Momentum: The RSI and the Stochastic RSI were both in the oversold zone, implying that the momentum was continuing in the downside direction.
Support and Resistance Levels Still Matter
The technical levels have been rendered invalid by recent price movement.
The cryptocurrency HYPE fell below the $59.84 support level as it was repeatedly rejected in the $63.39 resistance area. According to the Fibonacci retracement study, the coin continued falling below various levels of the Fibonacci retracement before reaching the 0.786 level at around $58.40.
Price movement took the price towards another technical level; specifically, the swing low at $57.65. Meanwhile, resistance continues to cluster around previous moving averages.
| Indicator | Level |
| Immediate support | $58.25 |
| Secondary support | $57.65 |
| Immediate resistance | $60.51 |
| Bollinger middle band | $60.71 |
| Next resistance | $61.09 |
| Major resistance | $63.39 |
Levels Traders Are Monitoring
- Support: $58.25 remains the immediate level after the latest decline, followed by $57.65.
- Resistance: Recovery attempts face resistance near $60.51, $60.71, $61.09, and $63.39.
- Breakdown: Price remains below the former $59.84 support level following the latest move lower.
Prop Trading Activity Expands on Hyperliquid Infrastructure
Beyond price movement, Hyperliquid continues supporting a growing number of crypto proprietary trading programs.
Funded trading first developed within traditional financial markets before expanding into crypto markets. In such a framework, traders will have to complete the evaluation process before receiving higher trading allocations without providing the total amount of the trading capital.
A number of cryptocurrency prop trading firms have chosen to work on the Hyperliquid platform instead of developing a separate exchange.
The trading framework involves the presence of a centralized limit order book, USDC settlement, API integration, sub-accounts, public account data, and the possibility of trading on various perpetual futures markets.
As per VanEck, the volume of transactions that were processed by Hyperliquid in the first quarter of 2026 amounted to about $633 billion, which was equal to 32%-44% of the total on-chain perpetual futures trading volume.
The system provides manual trading capabilities, algorithmic trading, market making, and AI trading on the same execution layer.
Derivatives Data Indicates Dominance of Long Positions
Hyperliquid price prediction also remained tied to derivatives positioning.
The long to short ratio for both Binance and OKX was above 1, meaning that traders were maintaining a higher number of long positions than short positions despite their recent performance.
During the previous 24 hours, approximately $2.83 million in long positions were liquidated compared with roughly $127,100 in short liquidations.
Open interest also remained elevated despite the decline. Total open interest stayed above $2.5 billion after previously exceeding $3 billion, showing that leveraged positions remained active while price retreated from recent highs near $70 toward the $60 area.
FAQs
Why did HYPE go below $59?
The downtrend trend for HYPE followed after it failed to break back above the resistance level of $61 and eventually broke down below the $59.84 support level due to sell off.
Inference drawn from the RSI & Stochastic RSI?
From the present RSI level of 23.02 and Stochastic RSI of 0.00 and 13.39, it can be concluded that HYPE is currently oversold because of its bearish momentum recently.
How does Hyperliquid work in crypto prop trading?
Some of the funded crypto trading exchanges use the services of the Hyperliquid via order book, API connection, USDC settlement, and perpetual futures.



