

- HYPE climbed above $61 and moved above its 20 and 50 EMAs with momentum indicators turning bullish on the charts.
- Short liquidations outnumbered long liquidations amid sustained high levels of open interest and high leverage.
- Resistance was tested at the level of the 100 EMA, while the support was seen at the $58.58 Fibonacci level.
Hyperliquid price prediction still stands after the asset recovers above the $61 mark due to better short-term technical performance and continuous trading in the derivatives market. The coin posted an increase of 3.39% within 24 hours and is now priced at $60.99 on CoinMarketCap, while on the one-hour timeframe, the price was trading close to $61.20 after a bounce from below $59.
Hyperliquid Price Prediction Indicates Better Short-Term Momentum
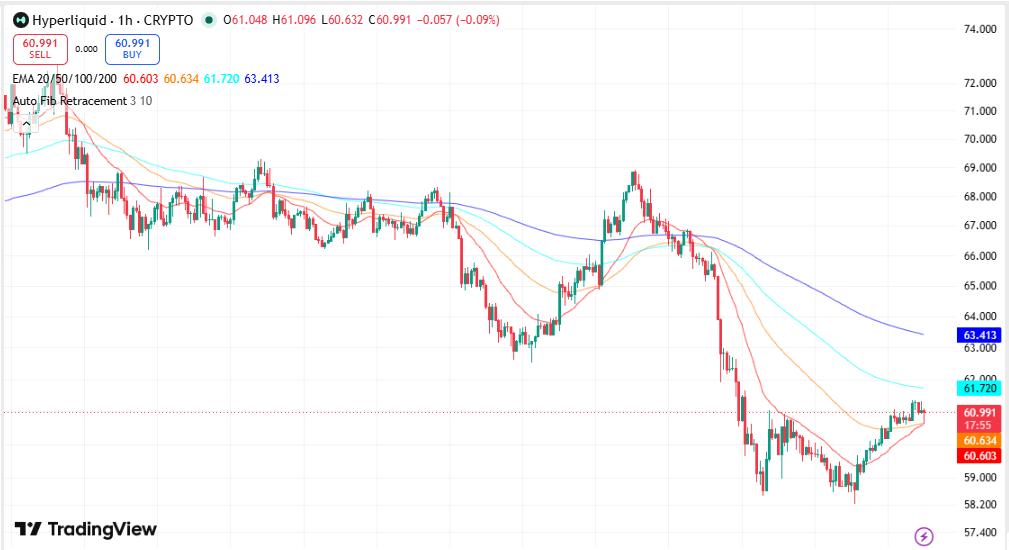
HYPE was trading close to $61.25 on the one-hour timeframe after rising by about 0.44% per hour. This occurred after a dip below $59 and formation of higher lows.
The technicals showed similar behavior. HYPE crossed above the 20 period EMA at $60.58 and 50 period EMA at $60.63, showing the fact that near-term buying pressure was improving.
Nevertheless, the overall technicals still looked mixed. The asset remained below the 100 EMA at $61.74 and 200 EMA at $63.44 that had almost become the resistance levels for the asset.
Source: Trading View
Some of the important technical aspects include:
- Price above 20 EMA and 50 EMA.
- Resistance remaining around the 100 EMA and 200 EMA.
- Higher lows continuing to develop following the rebound from below $59.
Improvement in Momentum Indicators
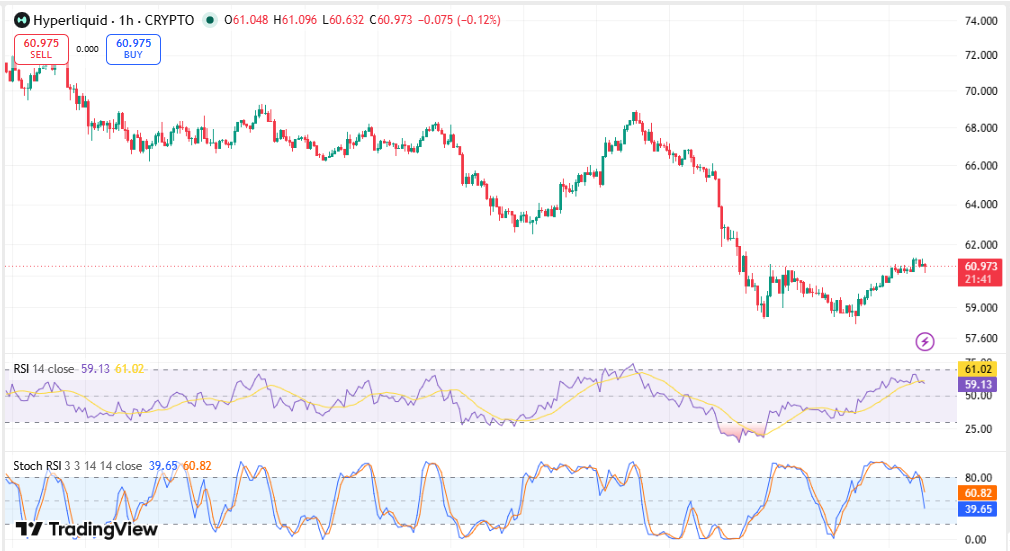
Momentum indicators have also shown positive market sentiments but no signs of overbought positions.
The Relative Strength Index (RSI) had a value of 63, meaning that there was an improvement in momentum but it was not overbought.
Source: Trading View
However, the values of Stochastic RSI were 66.98 and 78.18, implying that there was an improvement in momentum but at a stage that it would be hard to improve any further without buy pressures.
Another technical chart revealed that HYPE has recovered from support at around $58.58, which was also at the 0.236 Fibonacci Retracement level. Following that recovery, the price climbed back toward $61.20, placing the token near a short-term resistance area.
Current technical levels include:
| Indicator | Level |
| Current price | Around $61.20 |
| 20 EMA | $60.58 |
| 50 EMA | $60.63 |
| 100 EMA | $61.74 |
| 200 EMA | $63.44 |
| RSI | 63 |
| Fibonacci support | $58.58 |
A sustained move above the 100 EMA would place attention on the higher moving averages, while rejection could return focus to the support area near $60.60 and the Fibonacci level around $58.58.
Hyperliquid Derivatives Activity Remains Elevated
Derivatives positioning continued to provide additional insight into market participation.
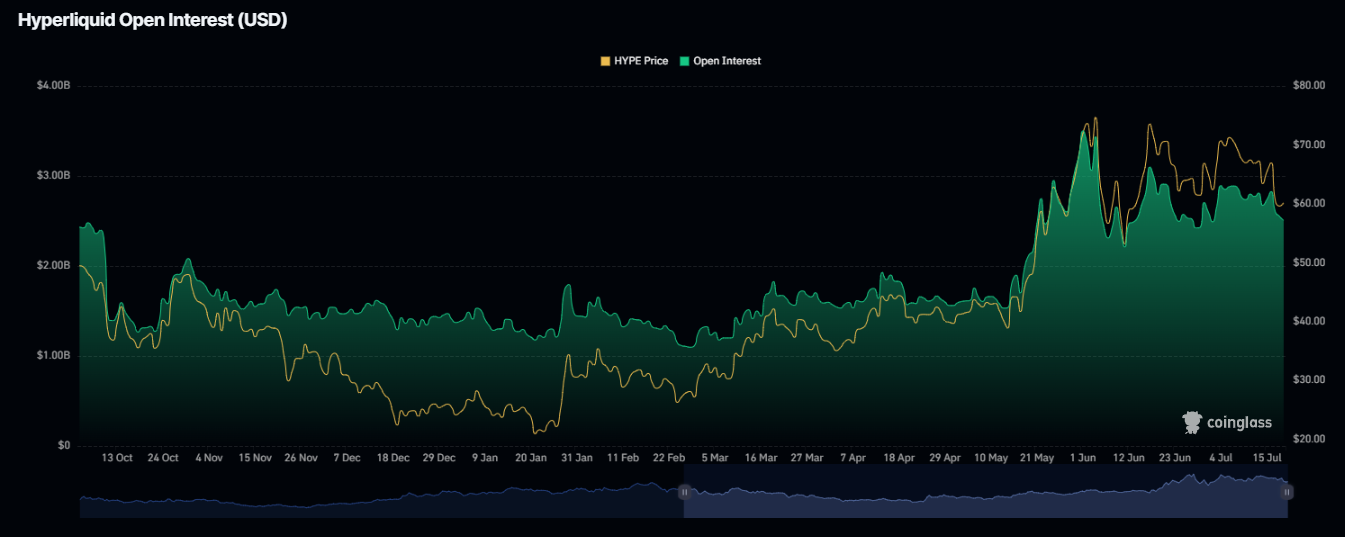
Open interest remained significantly higher than levels recorded earlier in the year. After beginning near $1.2 billion, open interest climbed above $3 billion during June before easing toward approximately $2.6 billion to $2.8 billion.
Source: Coinglass
Despite HYPE falling back from its highs over $70, the trader has been maintaining leverage on his/her position.
The presence of high open interest and recovering prices implies that derivative trading is still happening, thus increasing the likelihood of price movements in the event of a breakout of some technical level.
At the same time, liquidation statistics showed that bearish traders absorbed most recent forced closures.
During the past 24 hours:
- Total liquidations reached $1.16 million.
- Short liquidations totaled $793,340.
- Long liquidations reached $365,610.
This trend persisted during one hour, four hours, and twelve hours periods, during which short liquidations were always higher than long liquidations.
Moreover, exchange positioning showed that long positions were preferred, with both Binance and OKX having a long-to-short ratio staying above 1.4.
Largest Positions and HIP-3 Inquiries Make Headlines
Another set of platform information indicated that there was also some institutional level activity on Hyperliquid.
According to Odaily Planet Daily, there was a largest position exceeding $100 million after a lengthy period of inactivity. The wallet had a long position of 1,660 BTC for $107 million.
Position gains were worth an estimated $944,800 despite the use of around 30x leverage in the trading process. Equity connected with the trade was at approximately $4.09 million with the liquidation price being $63,127, which is 2.2% lower than the current BTC price level.
Other data indicated that HIP-3 trading volume had hit a record level with 46.6% of Hyperliquid’s trading volume over the last seven days coming from this instrument.
FAQs
How much is Hyperliquid (HYPE) currently valued?
According to the data on CoinMarketCap at the time of writing, HYPE was trading at around $61 and the 24-hour price was estimated to be at $60.99, reflecting 3.39% growth in a day.
Why is HYPE recovering?
Recovery comes after bouncing back above $59 level as HYPE is forming higher lows and breaking out above the 20 EMA and 50 EMA lines.
Which resistances should traders be eyeing?
In terms of technical analysis, there’s immediate resistance seen near the 100 EMA at $61.74 and then the 200 EMA at $63.44.
Which supports should traders be paying attention to?
There is immediate support seen near $60.60 and then strong support seen near $58.58, which is also in line with the 0.236 Fibonacci retracement level.
Which information can traders get from the recent liquidation data?
As per the liquidation data, there are short liquidations seen near $793,340 against long liquidations at $365,610 over the last 24 hours.



