

- Bitcoin hovered around $62,000 with a high level of market activity alongside technical caution because of volatility.
- The strategy involved the sale of 3,588 BTC and higher sales in the futures markets with purchases in the spot market.
- Bitcoin faces strong resistance above $63K, and support will be key for future price action.
Bitcoin Price is quite stable, having settled around the $62,000 range after starting the week on volatile notes due to high levels of volatility in derivative trading volumes and spot purchases, among others.
Moreover, there are several aspects that traders are taking into account, including the sale of part of Strategy’s Bitcoin holdings in order to distribute dividends, the position adjustment in the futures market, and greater participation in the blockchain network.
Despite the indication of a risk-averse environment by technicals, on-chain statistics show that the number of users is growing even after the decline.
Strategy’s Sale Causes Volatility in Bitcoin Prices
Bitcoin demonstrated strong volatility as its price rose to $64,000 on Sunday but fell back to $62,000 on Monday. Market data showed that Sunday’s advance was primarily driven by derivatives markets rather than spot demand.
Net futures buying reached approximately $415 million during Sunday’s session, including a four-hour period that generated nearly $687 million in buying pressure. That move forced the liquidation of roughly $33 million in bearish positions.
Nonetheless, the spot market remained slightly bearish at this time, suggesting that the participation in cash was not equal to the growth of interest in futures.
The market switched on Monday when a regulatory filing revealed that Strategy has sold 3,588 BTC for about $216 million. The firm said that the money will go for paying dividends, but the authority has granted permission to sell an extra $1.25 billion in Bitcoin if necessary.
After this disclosure, futures markets saw about $456 million worth of net selling in just four hours. Data on liquidations indicated that there were about $42 million of long positions and $49 million of short positions as the volatility spiked.
Nevertheless, towards the end of the trading session, the buying activity picked up. There were about $568 million in futures buys and nearly $143 million in spot buys, giving the market another structure compared to the one seen during the rally on Sunday.
Key Takeaways From Recent Market Movements
- The Sunday rally was primarily fueled by futures purchases, while spot purchases were still slightly bearish.
- The drop on Monday came following the disclosure by Strategy of their sale of 3,588 BTC for dividend payouts.
- Recovery later in the day saw both futures and spot purchases taking place.
Bitcoin Price Forecast Based On Higher Network Activity
Regardless of recent price movements, blockchain analytics suggested that Bitcoin network participation had been increasing.
Based on the data released from Glassnode, via Ali Charts, Bitcoin’s daily active addresses rose about 9% from late June to early July, breaking the level of $60,000 active addresses.
Active addresses per day is the number of unique wallet addresses conducting transactions within a 24-hour time period. It differs from derivative activity and single transactions between institutions.
An increase in Active Addresses Was Witnessed When There Was High Volatility in the Markets, Signifying That Activity Continued Even as Prices Dropped. Although this statistic does not have a predictive value, what was evident was that there were active players in the network during the last market correction.
Mixed Technical Signals Persist
From the Technical readings at TradingView for BITSTAMP: BTCUSD, the value of bitcoin is currently sitting at $63,051 in the ongoing trading session, representing a fall of about 2.48%.
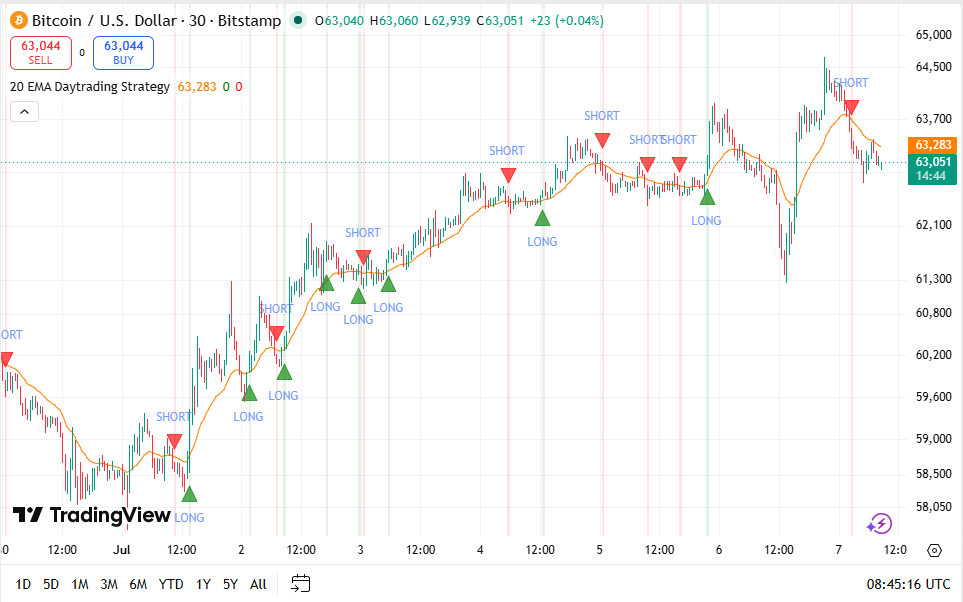
Source: Trading View
The technical indicators at TradingView were neutral, but some of the technical indicators issued a cautiously bearish signal. Among the total number of indicators studied, 12 indicated a sell signal, nine gave a neutral signal, and five were buy indicators.
However, the momentum indicators were not showing any strength of direction. The RSI had a value of 46, showing the presence of a neutral market and that Bitcoin was neither overbought nor oversold.
ADX reading of 30 implied moderate trends, while Stochastic %K of 70 implied improving momentum. However, the indicator had not reached a level that would suggest a high buying strength.
On the contrary, the MACD remained a buy signal despite being below zero at -1,117. This was an indication of weak bearish momentum compared to previous trading periods.
The Momentum Indicator and the Bull Bear Power, however, continued to favor buyers.
Quick Overview of Bitcoin Technical Indicators
| Indicator | Value | Current Signal |
| Bitcoin Price | $63,051 | Down 2.48% |
| RSI | 46 | Neutral |
| ADX | 30 | Moderate Trend |
| Stochastic %K | 70 | Improving Momentum |
| MACD | -1,117 | Buy Signal |
| TradingView analysis | — | Neutral |
| Sell Signals | 12 | BearishTrend |
| Neutral Signals | 9 | Neutral Trend |
| Buy Signals | 5 | Bullish Trend |
Movements Averages Create Significant Technical Supports and Resistances
Both short-term moving averages maintained the current levels for Bitcoin’s trading. Specifically, the 10-period EMA was trading at $61,831, and the 10-period SMA was at 61,069. Both averages stayed below the current market price level.
Resistance levels were noted to be incrementally higher than the medium-term moving averages. These included a 20-period EMA of $62,303, a 30-period EMA of $63,419, and a 50-period EMA of $65,641.
The long-term trend was noted to be lower compared to several key moving averages. Bitcoin was still trading below the 100-period EMA at $69,385 and the 200-period EMA at $75,510. This signified the fact that the overall correctional trend was still active.
Further technical analysis also pointed out a balanced structure of the market. In this respect, the Ichimoku Base Line was placed around $62,494. Moreover, the 20-period VWMA at $61,522 kept providing support. The Hull Moving Average was showing the sell signal around $63,790, which also provided the resistance.
Important Price Levels to Consider
- Support: 10 EMA ($61,831), 10 SMA ($61,069), VWMA ($61,522)
- Resistance: 20 EMA ($62,303), 30 EMA ($63,419), 50 EMA ($65,641)
- Pivot Point: $63,515 still holds significance for the short-term trend.
Bitcoin Price Prediction Indicates Important Levels to Come
TradingView places the Classic Pivot Point near $63,515, making that level an important area for short-term market direction.
A sustained move above the $62,500-$63,000 range, supported by an RSI advancing above 50 together with continued improvement in the MACD, would shift attention toward the next resistance area between $63,500 and $65,000.
FAQs
Why did Bitcoin fall recently?
Bitcoin fell after the strategy revealed that it had sold 3,588 BTC valued at about $216 million. This happened during the strong selling of futures and liquidations in the market.
Why do daily active addresses matter?
Daily active addresses mean the total number of distinct wallets that are transacting Bitcoin per day. This is an indicator that is used to measure network participation.
What is the level of the RSI?
RSI is currently equal to 46, meaning that Bitcoin is not overbought and not oversold.



