

- ZEC rallied above $420 and buyers defended the $390 to $398 support zone until the end of July.
- The EMA at $430 is the main barrier and if ZEC breaks out, higher resistance levels could come into play.
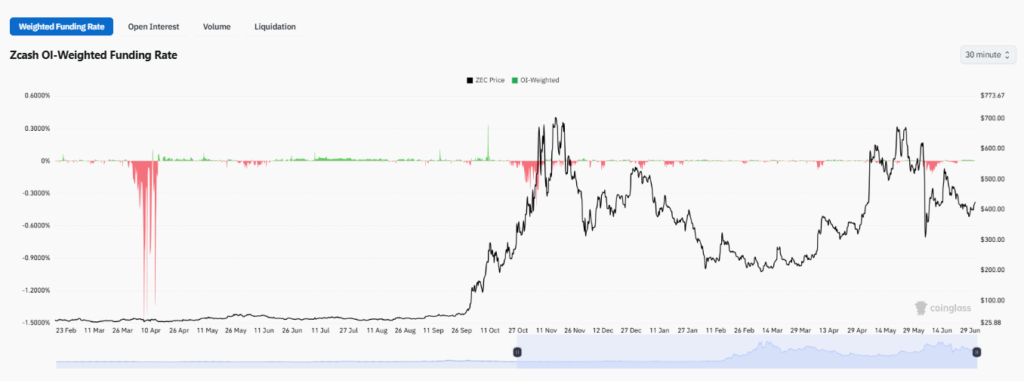
- Open interest rebounded to around $750 million and price held steady as traders came back into the game.
Zcash Price Prediction is still in the spotlight as ZEC started July trying to preserve the gains gained recently after the rather bumpy second quarter.
Even though the overall technical picture still seems biased towards the bears, it became clear that the bearish momentum has slowed down since the crypto has managed to stabilize at the $400 mark.
In turn, the price dynamics, the positioning in derivatives, and the technical are offering multiple points for consideration to determine what comes next from this consolidation phase.
As of press time , the price of Zcash (ZEC) is $420.30, which is a rise of 5.64% within the past 24 hours. The move was preceded by a drop to levels below $395, and after that, the buyers took control of the coin and pushed its price beyond the level of $420 to a daily high close to $425. At the same time, the market cap of the network was $7.04 billion.
Zcash Price Forecast Shows Resistance Is Near $430
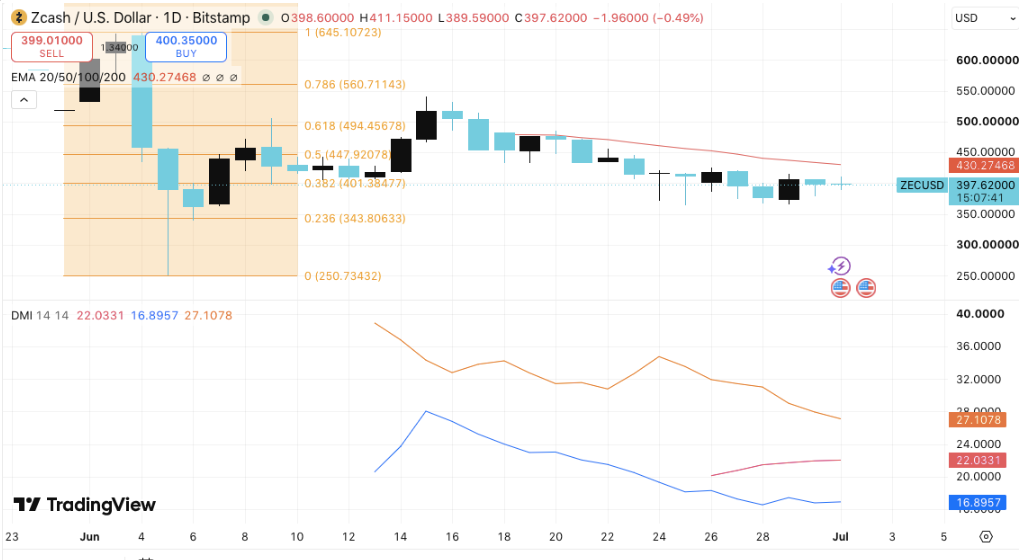
In spite of the rally, ZEC is still trading below its 20-day exponential moving average (EMA), which is close to the mark of $430.
In contrast to the previous drop, the candles on the chart are consolidating instead of further declining. The buyers are buying up against the support level in the range of $390 – $398 amid decreased selling pressure.
Source: Trading View
The following technical points describe the current market structure:
- ZEC is trading under the 20-day EMA line.
- Price continues consolidating above immediate support.
- Selling momentum has weakened compared with earlier sessions.
- Buyers have prevented another move below the recent lows.
The current price behavior is characterized by a consolidation phase when there is an assessment of the level of demand that would be able to test the resistance.
Momentum Trend Reveals Declining Bearish Pressure
Despite the fact that the Directional Movement Index still suggests that sellers dominate on the chart, since the negative directional indicator is still higher than the positive one,
Moreover, it is worth noting that the gap between them has become smaller than before. This has resulted in present technical conditions being as follows:
| Technical Indicator | Current Status | Market Significance |
| 20-day EMA | Close to $430 | First significant resistance |
| Immediate Support | $390-$398 | Current consolidation zone |
| Fibonacci Support | $384-$385 | Secondary support level |
| Significant Support | Close to $344 | Next bearish target |
| Directional Movement Index | Negative indicator is higher | Sellers have technical edge |
The convergence of momentum indicators is taking place amid the consolidation pattern that has formed near the $400 level.
Support Level is Still Determining Short-Term Risk Potential
The price action for now still revolves around the support zone in the area from $390 to $398, where buying interest comes up frequently.
Provided that the level stays intact, traders will keep their eye on the resistance at the 20-day EMA. In case the selling interest picks up, then the next technical reference level should be the 38.2% Fibonacci level at $384 to $385.
Any further dip below that level will cause the focus to shift on the more extended downside target of $344, which is the other significant technical support level in the existing market setup.
Primary downside levels
- $390–398: Key support and existing consolidation zone
- $384–385: Fibonacci support
- $344: Significant technical downside target
These are the primary levels of interest as long as ZEC ranges in the existing price action environment.
Resistance Zones Continue to Highlight the 20-day EMA
Moving up from there, the first resistance level continues to be the 20-day EMA at $430.
Any move above this level will bring into focus the $448 to $450 resistance level range, which coincides with the 50% Fibonacci retracement.
Above that level, the next important resistance range is in the area of $494 to $500, which is the upper objective seen in the current recovery scenario.
Primary resistance levels
- $430: 20-day EMA
- $448-450: Fibonacci resistance
- $494-500: Next major resistance objective
Such prices represent the main benchmarks if traders proceed to consolidate the ongoing recovery process.
Open Interest Recovery in Sync with Price Bounce
Derivatives trading has also witnessed renewed participation after several months of erratic market involvement.
Earlier open interest had seen a sharp rise in the wake of ZEC’s prior rally but then experienced a fall with the unwinding of leveraged positions during the correction period.
On the other hand, the open interest has been recovering to about $750 million, which happened after Zcash returned back to the $400 level. This growth is caused by more funds coming into the derivatives market together with increased activity on that market.
Source: Coinglass
In addition, high open interest along with relatively stable prices shows better market activity. On the other hand, high leverage can lead to bigger moves if there will be more liquidations.
Zcash Price Prediction Depends on a Potential Breakout of Its Present Ranges
The ongoing market structure still shows a balance between the buying side trying to defend their support levels and the selling side aiming at maintaining the downtrend.
Technical indicators continue favouring sellers because ZEC remains below its 20-day EMA, while weakening bearish momentum, recovering derivatives activity, and stable exchange participation indicate that downside pressure has moderated compared with previous weeks.
For the near term, Zcash Price Prediction continues to depend on whether buyers can maintain support between $390 and $398 while generating enough momentum to reclaim the $430 resistance level. A sustained move above the 20-day EMA would shift attention toward $448–450, followed by the $494–500 resistance area.
FAQs
What is the current Zcash price prediction?
Technical analysis of the asset indicates that ZEC is consolidating following its recovery. The price is trading below the 20-day EMA line at $430, and the support holds in the range of $390 to $398. The future direction will depend on whether the buyers manage to take control above the resistance or below the support.
Why is the $430 level significant for ZEC?
The $430 level corresponds to the 20-day EMA line, which acts as the primary resistance at the moment. Moving above this level would mean that the buyers have managed to gather short-term momentum.
What does the rise in Zcash open interest mean?
The open interest has recovered up to $750 million, signalling a revival in the derivatives’ trading activity.



